Financial Growth
A financial analysis tool that compares quarterly, annual, and TTM performance metrics, providing comprehensive insights into company growth through various financial indicators and visualization options.
Explore 11,183 indicators. Filter beyond the obvious.
Discover the tools that fit the way you trade.
11,183 tools to explore
A financial analysis tool that compares quarterly, annual, and TTM performance metrics, providing comprehensive insights into company growth through various financial indicators and visualization options.
A Pine Script tool for calculating Compound Annual Growth Rate (CAGR) by interactively selecting two time points on a chart, providing an annualized performance metric.
A comprehensive trading tool that compares fundamental metrics across multiple assets using various charting methods, enabling detailed financial analysis and visualization.
A dynamic trading system dividing market time into four quarterly phases, using fractal time analysis to identify optimal entry and exit points across different market conditions.
CANSLIM is an advanced stock screening strategy that evaluates companies across seven critical growth indicators to identify potentially high-performing stocks in the market.
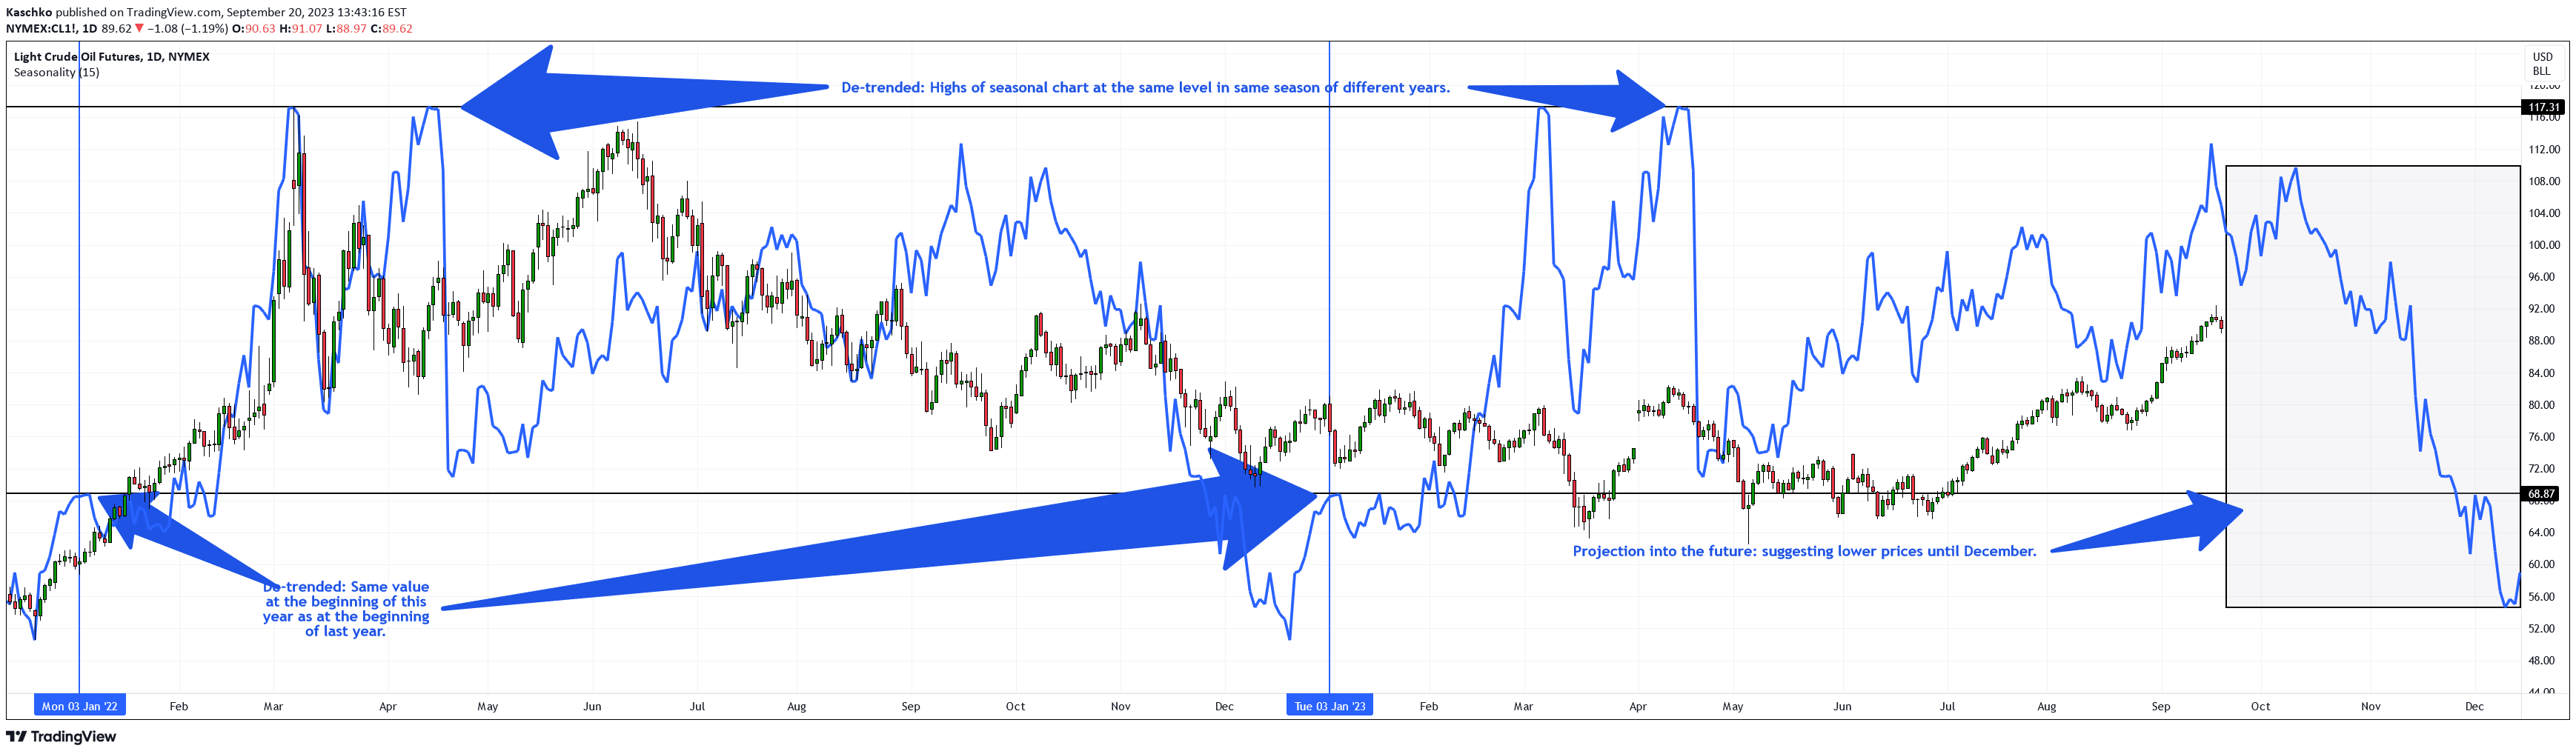
A seasonal trend analysis tool that calculates average price moves across multiple years to create a projected seasonal chart overlay, revealing potential market behavior patterns.
A comprehensive risk assessment tool that dynamically calculates multiple performance metrics, providing investors with adaptive insights into investment volatility, drawdown, and risk-adjusted returns.
A sophisticated risk scoring system that calculates position size by evaluating stock performance, volatility, trader metrics, and drawdown tolerance for more precise trading risk management.
An advanced trading indicator that compares historical annual percentage returns between two financial symbols, providing visual comparative analysis through a column-based graphical representation.
A Pine Script indicator that analyzes financial performance by tracking EPS, sales growth, and stock price changes to help traders make informed investment decisions.
A financial indicator analyzing key growth metrics like earnings per share, revenue, and gross margins to help investors assess a company's financial performance and potential.
A multi-timeframe price level indicator that visualizes key support and resistance zones across different time periods, helping traders identify critical price levels for strategic decision-making.
Likes, views, and comments are historical TradingView snapshots. They describe attention, not trading performance.