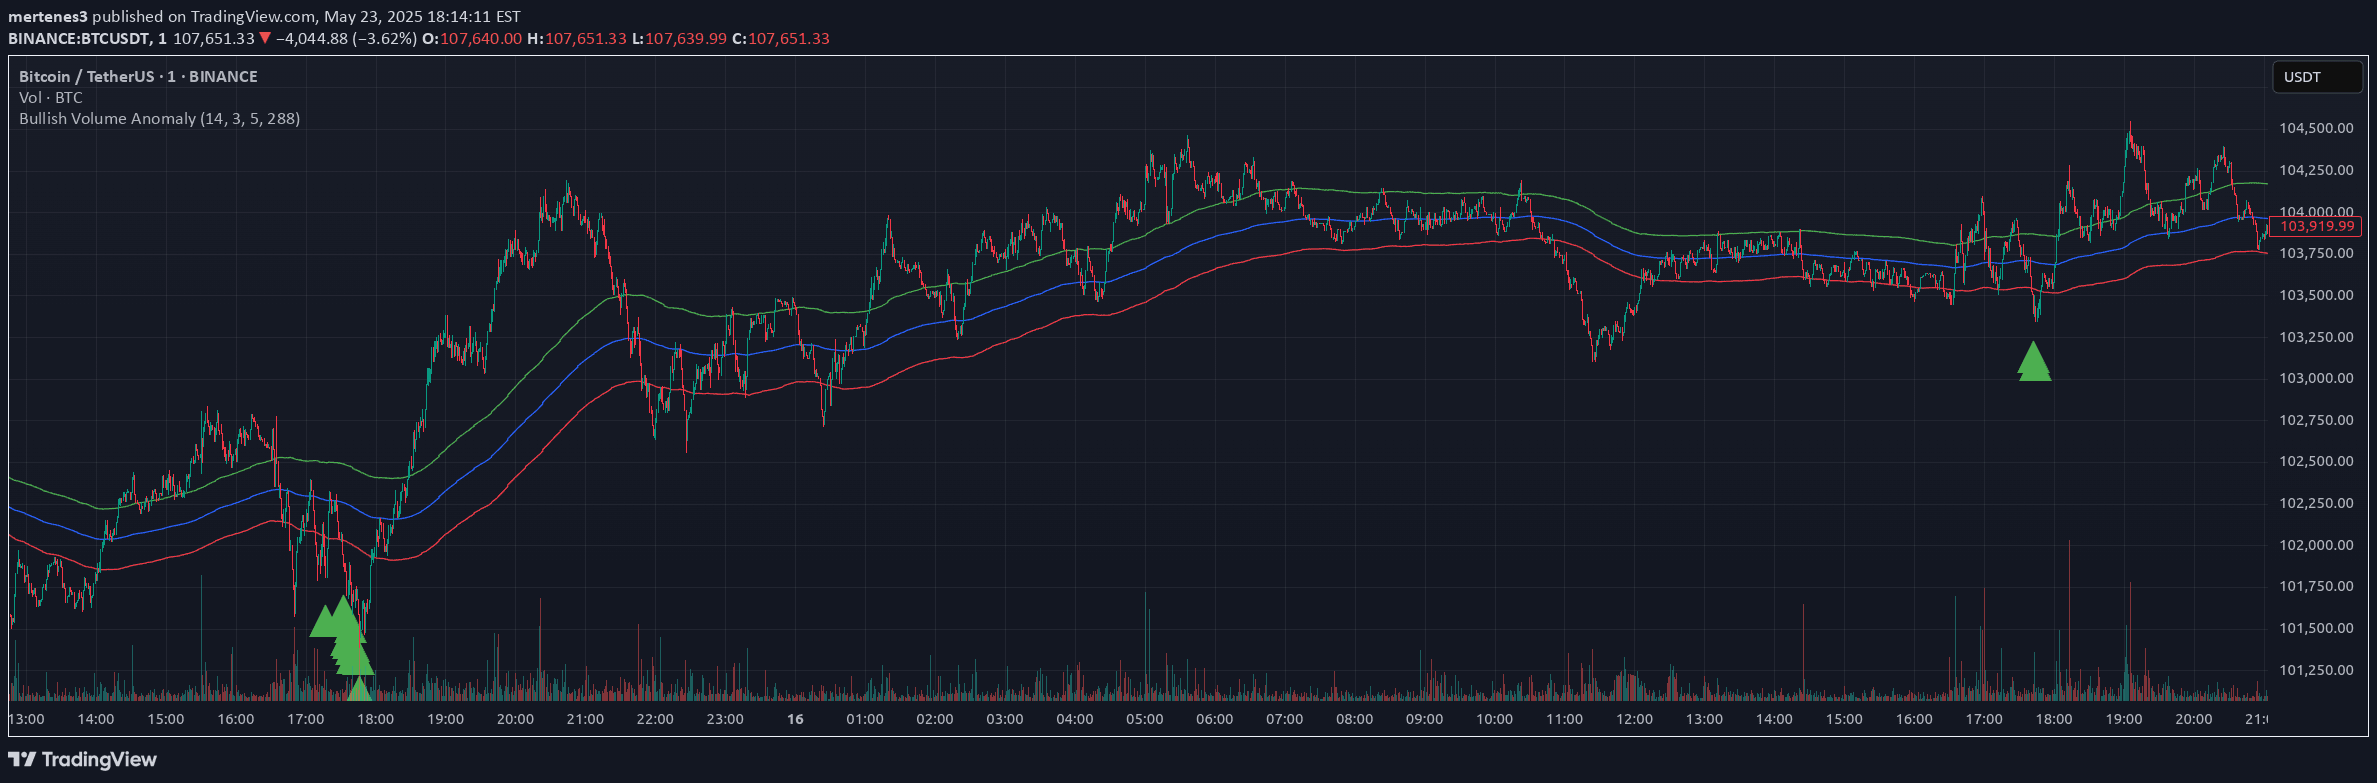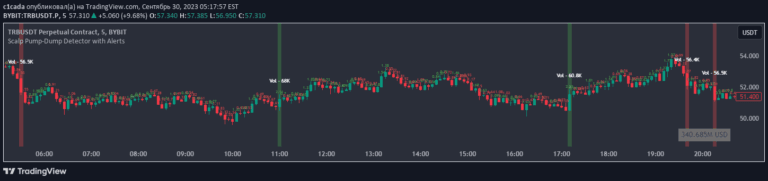
Scalp Pump-Dump Detector with Alerts
A script that tracks percentage movements of chart candles and identifies abnormal price movements, allowing traders to set alerts for significant price changes.
Explore 11,183 indicators. Filter beyond the obvious.
Discover the tools that fit the way you trade.
11,183 tools to explore
A script that tracks percentage movements of chart candles and identifies abnormal price movements, allowing traders to set alerts for significant price changes.
A volatility indicator that detects market anomalies by calculating the delta between volume-weighted and simple moving averages and applying statistical analysis to identify extreme price movements.
A statistical method using standard deviation to detect price anomalies, identifying potential market turning points by measuring significant deviations from the mean price.
A volume anomaly detector that identifies large institutional orders and block trades by comparing current volume to moving average, helping traders anticipate potential market-moving events.
A specialized indicator that detects early bullish accumulation by analyzing volume trends, price momentum, and volatility before a potential breakout.
A volume-based trading indicator that identifies significant volume changes and signals potential trading opportunities by detecting unusual volume spikes compared to a predefined lookback period.
A volatility analysis tool that compares short-term and long-term historical volatility to identify potential price anomalies and trading opportunities through visual dot clusters.
The Triad Macro Gauge combines VIX, Credit Spreads, and Stocks/Bonds Ratio to provide a comprehensive view of market sentiment and macroeconomic conditions.
A day-of-week performance indicator that calculates and visualizes cumulative percentage changes for each trading day, revealing potential calendar-based market anomalies.
A monthly bull-bear ratio indicator that calculates and displays the probability of bullish or bearish lines for up to 10 trading symbols within a specified time range.
A trading indicator that compares performance between even and odd days, revealing potential calendar-based market anomalies and performance patterns across different trading days.
Solar Cycle indicator calculates precise astronomical solar positioning, mapping the Sun's annual cycle to a normalized -1.0 to +1.0 value for identifying seasonal market patterns.
Likes, views, and comments are historical TradingView snapshots. They describe attention, not trading performance.