
YOUR INDICATOR RESEARCH STARTS HERE

Find the right indicator.
Understand what it does.

Explore 11,183 indicators. Filter beyond the obvious.
Discover the tools that fit the way you trade.

THE INDICATOR LIBRARY

Results for “arbitrary”

11,183 tools to explore

11 indicators matching your filters
Save search
TrendVolatilitySignal

ATR Based Zigzag w EMA

by HabibiBudo

An ATR-based trend detection tool that dynamically identifies market trends using volatility breakouts and visualizes direction through a smoothed EMA line with adaptive color signaling.

Main price chart · unverifiedScalping · Day Trading
Explore
728likes10.2Kviews5comments
Save
MomentumOscillator

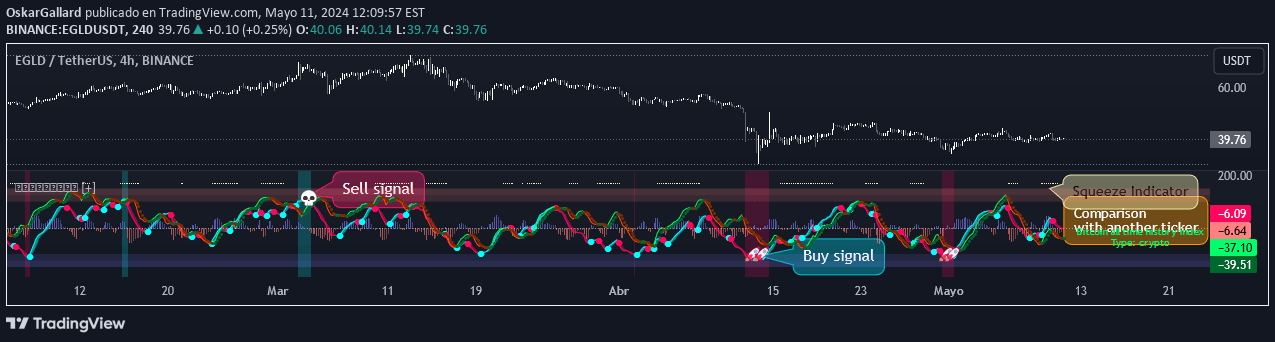
WaveTrend Oscillator Plus

by OskarGallard

An advanced technical analysis tool that identifies overbought and oversold market conditions using dynamic standard deviation calculations and enhanced oscillation levels.

Separate pane · unverifiedScalping · Day Trading
Explore
675likes14.9Kviews21comments
Save
SignalTrend

Custom Time Frame (CTF)

by The_Peaceful_Lizard

A flexible custom timeframe indicator with moving average analysis using Chebyshev filter, allowing traders to create personalized chart intervals and enhanced market insights.

Main price chart · unverifiedScalping · Day Trading
Explore
229likes4.9Kviews6comments
Save
SignalTrend

Adaptive Moving Averages

by Julien_Eche

An adaptive moving averages indicator that automatically adjusts periods based on timeframe and market type, offering sophisticated and flexible technical analysis across different trading environments.

Main price chart · unverifiedScalping · Day Trading
Explore
155likes1.9Kviews2comments
Save
LevelsSignal

Arbitrary Horizontal Lines

by NobbiTrading

A tool for drawing multiple horizontal lines on a chart to identify key support and resistance levels across different price points, helping traders visualize potential trading zones.

Main price chart · unverifiedScalping · Day Trading
Explore
80likes2.5Kviews5comments
Save
OscillatorTrendVolume

Volume Price Trend (VPT)

by BiggWigg

Volume Price Trend (VPT) is a technical indicator that combines price and volume to assess trend strength and potential trend reversals by tracking volume changes.

Separate pane · unverifiedScalping · Day Trading
Explore
74likes4.4Kviews1comments
Save
OscillatorSignal

Random Signal Generator

by Anikeev_Pavel

A random signal generator that creates unpredictable buy and sell signals on trading charts, designed for educational and testing purposes without real trading application.

Separate pane · unverified
Explore
49likes2.1Kviews0comments
Save
LevelsSignalVolatility

Days in range

by goofoffgoose

A flexible trading tool for analyzing price ranges and market behavior, enabling traders to count bars inside and outside specified price and date ranges.

Main price chart · unverifiedScalping · Day Trading
Explore
46likes2.4Kviews4comments
Save
LevelsVolatility

Visual ATR Stop

by StockLeave

An ATR-based indicator that visually displays stop-loss ranges by creating a volatility-adjusted zone above or below price, helping traders set dynamic risk management levels.

Main price chart · unverifiedScalping · Day Trading
Explore
27likes672views0comments
Save

Likes, views, and comments are historical TradingView snapshots. They describe attention, not trading performance.

START WITH A QUESTION

A little less searching.
A lot more understanding.

Tell DeepAlpha what you need. Get an explanation, a shortlist,
and a direct path to the indicators behind it.

Ask DeepAlpha