YOUR INDICATOR RESEARCH STARTS HERE

Find the right indicator.
Understand what it does.

Explore 11,183 indicators. Filter beyond the obvious.
Discover the tools that fit the way you trade.

THE INDICATOR LIBRARY

Results for “bubbles”

11,183 tools to explore

11 indicators matching your filters
Save search
LevelsVolatilityVolume

Liquidation Levels [LuxAlgo]

by LuxAlgo

A signal that identifies potential liquidation price levels where highly leveraged traders' positions may be forcibly closed, revealing key market support and resistance zones.

Main price chart · unverifiedScalping · Day Trading
Explore
4Klikes105.3Kviews18comments
Save
LevelsSignal

Liquidity Grabs | Flux Charts

by fluxchart

A liquidity grab indicator that highlights market order execution points by rendering unique bubbles on candles where significant liquidity areas are swept with large wicks.

Main price chart · unverifiedScalping · Day Trading
Explore
3.5Klikes75.5Kviews9comments
Save
OscillatorVolume

Bubbles Volume [BigBeluga]

by BigBeluga

A visual volume indicator that represents trading volume as dynamic bubbles on price charts, providing intuitive insights into market activity and trading intensity.

Main price chart · unverifiedScalping · Day Trading
Explore
1.2Klikes19Kviews20comments
Save
MomentumSignalVolume

Stop Cascade Detector

by DskyzInvestments

A trading tool that detects stop-loss cascades by analyzing price momentum and volume spikes, revealing potential market turning points and explosive price movements.

Main price chart · unverifiedScalping · Day Trading
Explore
426likes6.3Kviews4comments
Save
TrendSignalOscillator

(mab) Dynamic Bitcoin NVT Signal

by happymab

Network Value Transaction (NVT) Ratio assesses Bitcoin's network valuation by comparing market cap to blockchain transaction volume, offering insights into market growth and potential bubbles.

Separate pane · unverifiedSwing Trading
Explore
138likes2.3Kviews0comments
Save
OscillatorSignalVolume

VSA Wyckoff Volume with Bubbles

by GoldForexDoc

A volume analysis indicator using Volume Spread Analysis and Wyckoff principles to categorize market volume into six levels with color-coded visual representations.

Separate pane · unverifiedScalping · Day Trading
Explore
126likes6.4Kviews2comments
Save
LevelsTrendVolume

Alternative Price [OmegaTools]

by OmegaTools

A sophisticated price visualization tool offering multiple charting modes that help traders interpret market data through innovative visual representations and advanced customization features.

Main price chart · unverifiedScalping · Day Trading
Explore
76likes1.6Kviews2comments
Save
TrendVolatilitySignal

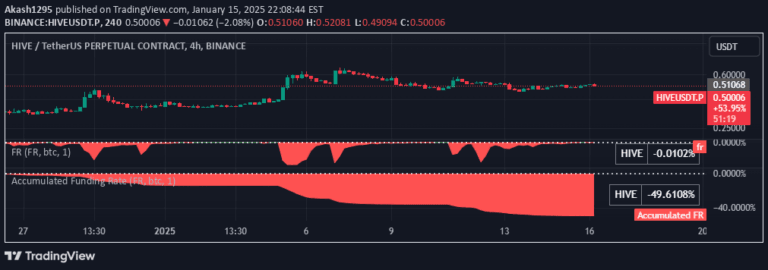
Accumulated Funding Rate

by Akash1295

Accumulated Funding Rate tracks price imbalances between spot and future markets by analyzing long and short funding fees over time.

Separate pane · unverifiedDay Trading · Swing Trading
Explore
13likes589views0comments
Save

Likes, views, and comments are historical TradingView snapshots. They describe attention, not trading performance.

START WITH A QUESTION

A little less searching.
A lot more understanding.

Tell DeepAlpha what you need. Get an explanation, a shortlist,
and a direct path to the indicators behind it.

Ask DeepAlpha