
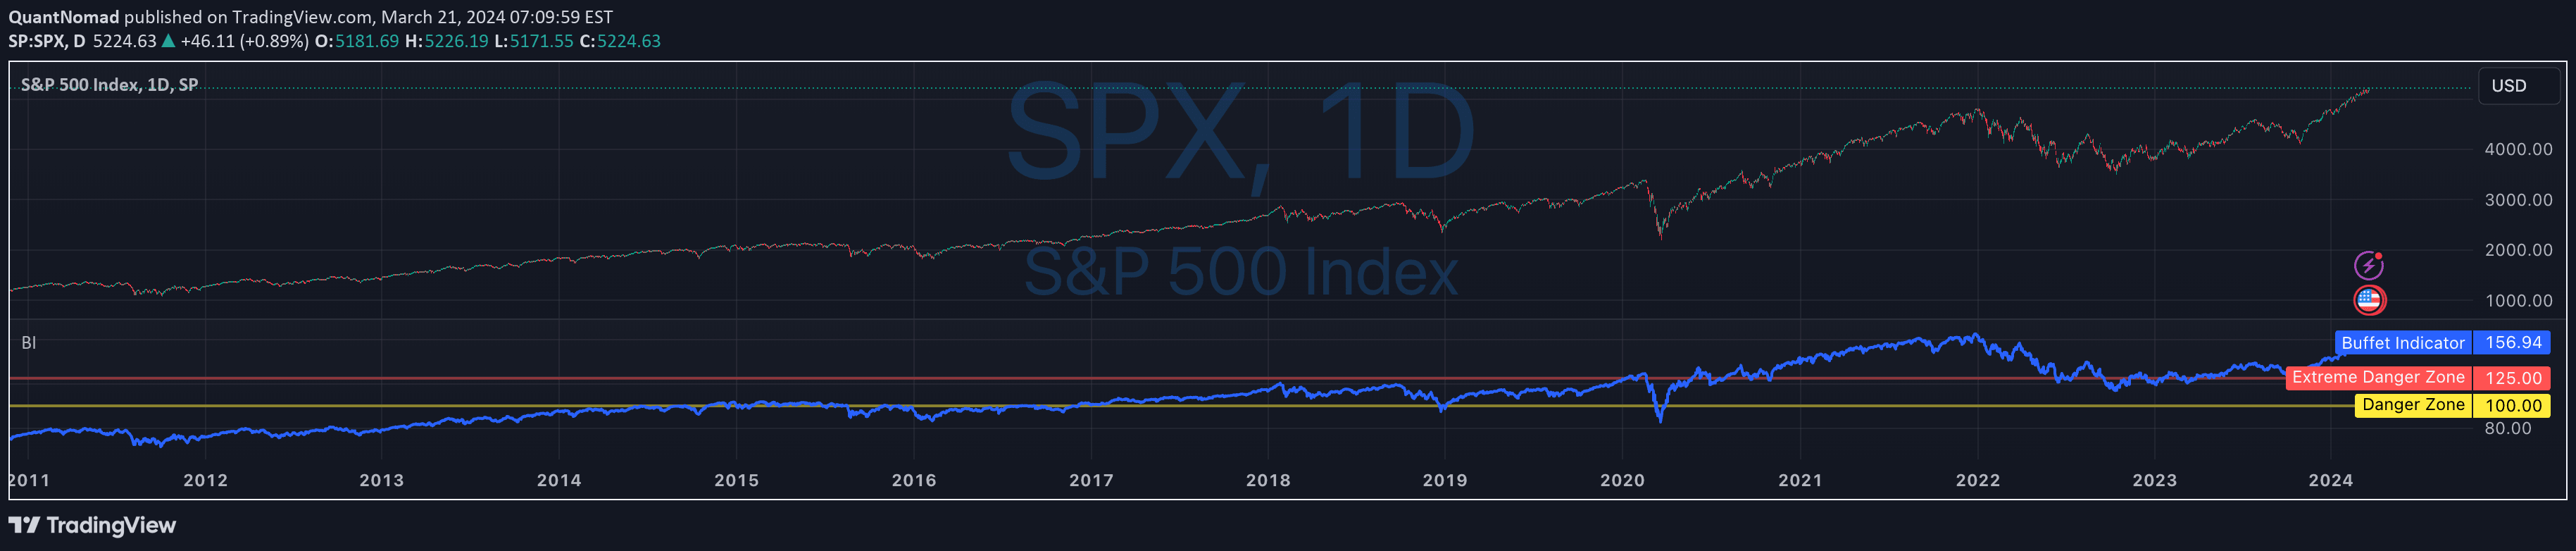
Buffett Indicator
A market valuation indicator comparing total stock market capitalization to US GDP, providing insight into potential market overvaluation or undervaluation.
Explore 11,183 indicators. Filter beyond the obvious.
Discover the tools that fit the way you trade.
11,183 tools to explore
A market valuation indicator comparing total stock market capitalization to US GDP, providing insight into potential market overvaluation or undervaluation.
The Buffett Valuation Indicator assesses stock market valuation by comparing total market capitalization to GDP, using Bollinger Bands to identify overvalued or undervalued market conditions.
The Buffett Indicator compares total US stock market capitalization to GDP, revealing market valuation levels and potential over or undervaluation across different economic periods.
Buffett Ratio tracks the total US stock market capitalization relative to GDP, providing a broad market valuation metric to assess potential over or undervaluation of equities.
Triangular Moving Average smooths price data to reveal clearer trend directions using a centered, asymmetric approach with variable band widths.
Likes, views, and comments are historical TradingView snapshots. They describe attention, not trading performance.