Price Action Smart Money Concepts [BigBeluga]
Advanced toolkit analyzing market structure and institutional investor behavior through interconnected indicators that reveal supply, demand, and potential price movement patterns.
Explore 11,183 indicators. Filter beyond the obvious.
Discover the tools that fit the way you trade.
11,183 tools to explore
Advanced toolkit analyzing market structure and institutional investor behavior through interconnected indicators that reveal supply, demand, and potential price movement patterns.
A trading indicator that calculates volume delta and open interest delta, providing insights into market sentiment and trading activity across different price levels and asset types.
A trading signal that analyzes price action in relation to volume pressure, providing insights into market trends through volume-based histograms and buy-sell convergence/divergence indicators.
SwingArms is a color-coded trend indicator that visually confirms market trend changes using green and red signals for bullish and bearish movements respectively.
Volume Suite provides multiple volume-based indicators to analyze trading activity, including Volume Delta, CVD, Buy/Sell Volume, and Relative Volume for comprehensive market insights.
A charting tool that tracks money flow and trading pressure across different price ranges, revealing market sentiment and significant price levels through buying and selling activity visualization.
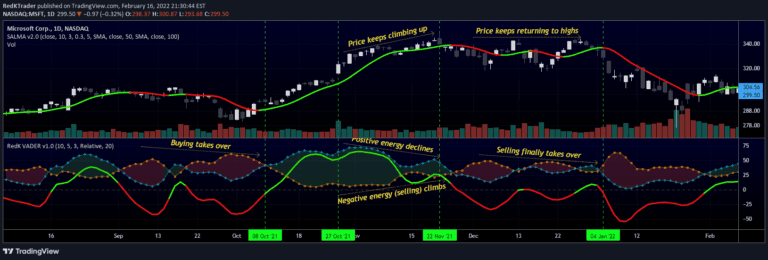
VADER is a volume-based technical indicator that measures market energy by analyzing price displacement and trading volume to determine bullish or bearish market sentiment.
A comprehensive price action toolkit that analyzes market structure, liquidity, order blocks, and trend lines to help traders identify potential entry and exit points.
A volume delta indicator that analyzes intrabar volume to estimate buying and selling pressure by calculating five distinct volume balances and divergence channels.
A cumulative volume delta indicator that analyzes intrabar volume to provide insights into market sentiment by tracking net buying and selling pressure across different time frames.
Advanced trading indicator integrating order blocks, liquidity levels, fair value gaps, and market structure to provide comprehensive market analysis and trading insights.
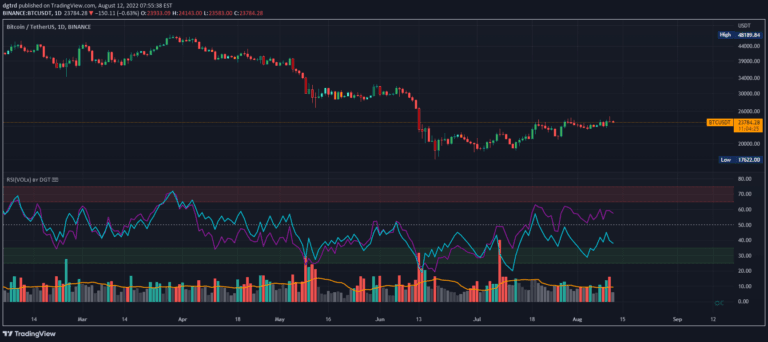
RSI is a momentum oscillator measuring price movement speed, analyzing price changes and volume to identify potential trend reversals and market conditions.
Likes, views, and comments are historical TradingView snapshots. They describe attention, not trading performance.