Higher Time Frame Chart Overlay
A customizable Pine Script indicator that generates a mini-chart displaying the last 10 candles with detailed visual settings, providing quick insights into recent price action and market behavior.
Explore 11,183 indicators. Filter beyond the obvious.
Discover the tools that fit the way you trade.
11,183 tools to explore
A customizable Pine Script indicator that generates a mini-chart displaying the last 10 candles with detailed visual settings, providing quick insights into recent price action and market behavior.
A multi-symbol scanner that tracks price movements against previous day, week, and month highs and lows, providing visual and alert-based tracking of key market levels.
A compact 3-day lookback indicator that visually tracks price movement relative to previous day's high and low ranges using color-coded signals.
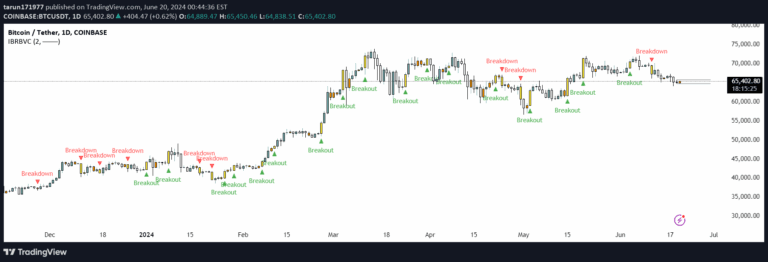
Inside bars are trading pattern where the current bar's price range is completely contained within the previous bar's range, offering potential trend continuation or reversal signals.
A comprehensive trading dashboard that combines multiple technical indicators to provide a quick overview of market conditions, helping traders assess trend direction and potential trading opportunities.
A TradingView script featuring a pixel art representation of Luffy from One Piece, designed as a compact and open-source companion for traders to customize and enjoy.
A trading tool that calculates stop loss and take profit levels using percentage-based inputs, helping traders visually assess and manage trade risk with precision.
A 30-minute interval indicator that uses color-coded boxes to visualize price movements, highlighting momentum shifts and short-term market dynamics.
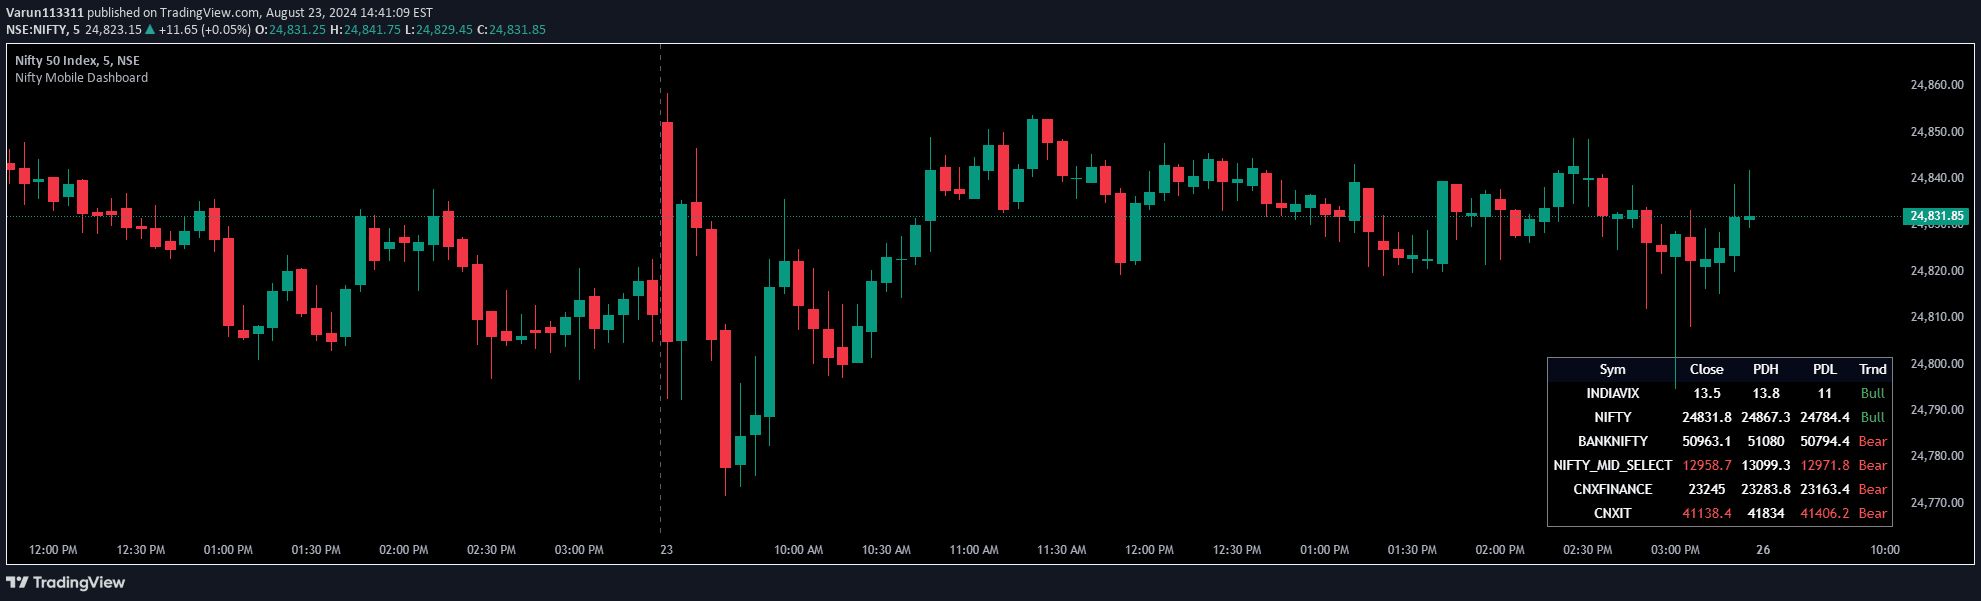
A mobile dashboard indicator that provides a compact table on TradingView charts, displaying key market data for up to six financial instruments with customizable settings.
A custom volatility indicator that calculates three price ranges based on Daily Average True Range (ATR), providing quick visual insights into potential price movements across different timeframes.
Volumetric Tensegrity is a compact volume analysis tool that measures market pressure and directional conviction through volume deviation and on-balance volume tracking.
A customizable visual indicator for trading charts that allows multiple oscillator sources, dividing lines, and candle fill options to enhance chart readability and trading insights.
Likes, views, and comments are historical TradingView snapshots. They describe attention, not trading performance.