Linear Regression Channel
A Linear Regression Channel indicator that tracks price trends, identifies channel breakouts, and analyzes momentum direction using dynamic visual signals and customizable settings.
Explore 11,183 indicators. Filter beyond the obvious.
Discover the tools that fit the way you trade.
11,183 tools to explore
A Linear Regression Channel indicator that tracks price trends, identifies channel breakouts, and analyzes momentum direction using dynamic visual signals and customizable settings.
A Volume Profile indicator that calculates trading volumes within a fixed range, helping traders understand volume distribution and identifying key price levels with visual representation.
A volume-based indicator that identifies supply and demand zones on a chart, revealing potential support and resistance levels using precise volume and price analysis.
A trading indicator that identifies breaker blocks and highlights potential entry points by detecting price action around support and resistance zones with premium/discount swing levels.
A technical analysis script that identifies cup-like price formations by creating channels and tracking potential breakout points in financial markets using specific bar search and channel width parameters.
A dynamic trend indicator using Zero-Lag Moving Average and EMA to detect market momentum shifts, highlighting trend reversal levels and potential price zones.
A predictive indicator that estimates future trading ranges by providing dynamic support and resistance levels while helping traders identify price trend directions in real-time.
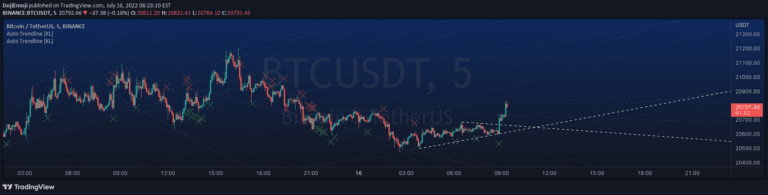
An automated tool that systematically draws trend lines by connecting recent fractals, helping traders identify potential price action patterns without subjective manual drawing.
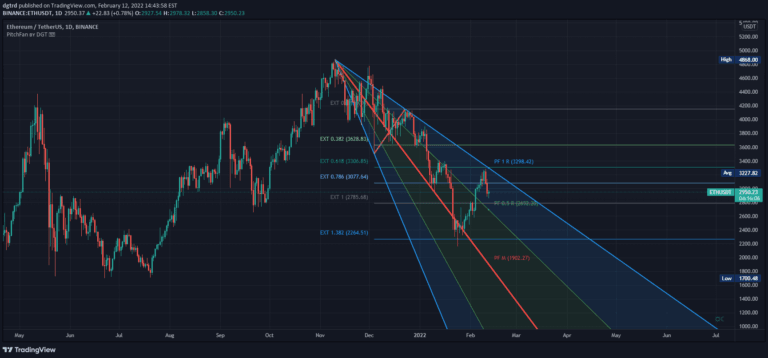
An advanced trading tool combining PitchFan, Fibonacci Extensions/Retracements, and ZigZag to identify potential support, resistance levels, and trend continuation signals.
A dynamic support and resistance indicator that predicts zones based on market trend, providing real-time insights into potential price reversal and continuation points.
A market structure indicator that identifies trend reversals and continuations by tracking protected highs and lows, helping traders recognize significant price movement shifts.
A trading signal that combines trend bias, oscillator analysis, and divergence detection to help traders make more informed decisions about trend continuation, reversal, and potential profit-taking.
Likes, views, and comments are historical TradingView snapshots. They describe attention, not trading performance.