Open Interest Suite [Aggregated] - By Leviathan
An advanced Open Interest indicator that provides comprehensive market insights through multiple visualization techniques and real-time statistical analysis of trading positions.
Explore 11,183 indicators. Filter beyond the obvious.
Discover the tools that fit the way you trade.
11,183 tools to explore
An advanced Open Interest indicator that provides comprehensive market insights through multiple visualization techniques and real-time statistical analysis of trading positions.
An advanced technical indicator using dual EMAs and volatility-adjusted bands to detect market trends, providing dynamic and adaptive trend analysis across different market conditions.
An advanced Open Interest indicator that visualizes market positioning by tracking contract changes and aggregating trading activity across different price levels.
A momentum indicator that uses Hull Moving Average to track price shifts, creating dynamic five-level zones that highlight momentum strength and potential trend changes.
A dynamic trend-following indicator using Triangular Hull Moving Average that provides smoothed price analysis with volatility insights and trend reversal signals.
A sophisticated trading indicator combining polynomial regression with dynamic Keltner Channels to analyze market trends, volatility, and potential trading opportunities across multiple timeframes.
FRAMA Channel is a dynamic trend-following indicator that adapts to market conditions, creating an adaptive channel around price to identify trend changes and market momentum.
A trend-following system that uses volatility-scaled steps to track market momentum, visualizing trend progression through discrete channels and adaptive volatility bands.
A volatility-based indicator that identifies price contraction periods by analyzing band narrowing and price behavior, signaling potential upcoming market movements.
Faytterro Bands are a channel indicator similar to Bollinger Bands, using weighted moving averages and standard deviations to identify market price zones.
A comprehensive trading indicator using Hull Moving Averages to detect trend continuations, volatility, and potential entry points across different market conditions.
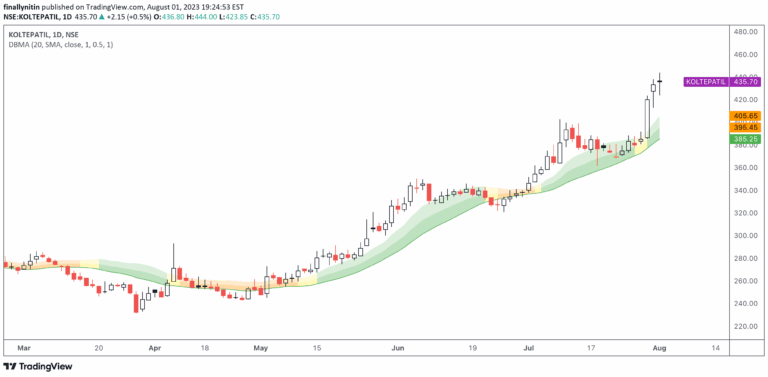
A Dual Bollinger Moving Average (DBMA) indicator that uses moving averages and Bollinger Bands to analyze price compression and potential trading opportunities.
Likes, views, and comments are historical TradingView snapshots. They describe attention, not trading performance.