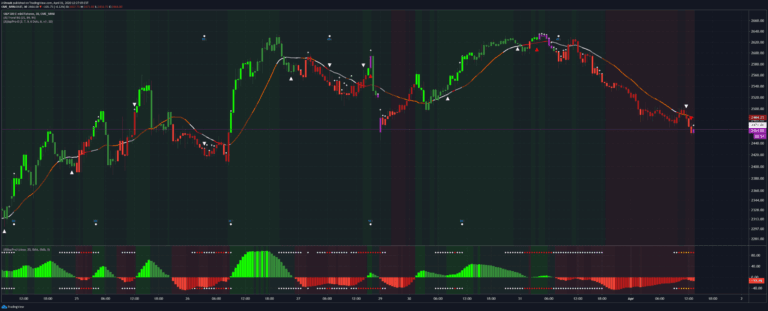
CM MACD Custom Indicator - Multiple Time Frame - V2
CM MACD Ultimate Multi-Timeframe V2 is an advanced MACD indicator with enhanced customization options, multi-timeframe analysis, and comprehensive trend visualization features.
Explore 11,183 indicators. Filter beyond the obvious.
Discover the tools that fit the way you trade.
11,183 tools to explore
CM MACD Ultimate Multi-Timeframe V2 is an advanced MACD indicator with enhanced customization options, multi-timeframe analysis, and comprehensive trend visualization features.
An advanced all-in-one trading strategy builder that combines over 30 indicators to generate custom buy and sell signals across multiple timeframes and trading styles.
An advanced trading strategy measuring the opening range of a trading session to identify potential breakout opportunities and determine market trend direction with precise entry and exit points.
A dynamic trend indicator using Zero-Lag Moving Average and EMA to detect market momentum shifts, highlighting trend reversal levels and potential price zones.
Ghost Tangent Crossings is an innovative pivot point indicator that visualizes market movements using ellipses, dynamically tracking zig-zag patterns and potential price breakouts.
AlphaTrend is a dynamic trend-following indicator that uses Money Flow Index or RSI to generate buy and sell signals based on trend direction and momentum crossovers.
A trading script combining Exponential Moving Averages (EMAs) and Stochastic RSI to identify market trends, momentum shifts, and potential entry or exit points for traders.
A comprehensive divergence analysis tool that calculates divergence strength across multiple indicators, providing a single metric to assess potential market reversals and trend shifts.
Session Sweeps indicator identifies liquidity pools and market shifts across major trading sessions, using session highs/lows to detect potential trend changes and entry points.
Kalman Trend Levels is an advanced indicator that identifies trend shifts, support/resistance zones, and momentum changes using dynamic Kalman filter crossovers and adaptive visualization techniques.
A dynamic trend analysis tool using Hull-EMA curves that color-codes price bars, plots support/resistance boxes, and identifies high-probability breakout retests for traders.
A multi-feature trading signal indicator that identifies market squeeze conditions using Bollinger Bands and Keltner Channels with customizable overlay options for entry and exit signals.
Likes, views, and comments are historical TradingView snapshots. They describe attention, not trading performance.