YOUR INDICATOR RESEARCH STARTS HERE

Find the right indicator.
Understand what it does.

Explore 11,183 indicators. Filter beyond the obvious.
Discover the tools that fit the way you trade.

THE INDICATOR LIBRARY

Results for “dailyrange”

11,183 tools to explore

10 indicators matching your filters
Save search
VolatilityLevels

Daily Standard Deviation (fadi)

by fadizeidan

The Daily Standard Deviation indicator maps price movements using statistical analysis, revealing typical price ranges and potential reversal points by measuring price dispersion around a mean.

Main price chart · unverifiedScalping · Day Trading
Explore
881likes10.8Kviews18comments
Save
LevelsVolatility

ADR % Ranges

by GoodGains

An indicator that calculates average daily range percentages to help traders identify price movement boundaries and potential trading targets based on historical price performance.

Main price chart · unverifiedScalping · Day Trading
Explore
438likes11.3Kviews4comments
Save
MomentumSignalTrend

Range Based Signals and Alerts

by serkany88

A multi-timeframe trading signal strategy using daily high-low points, moving averages, and MACD to identify potential price reversals and trend changes across different market conditions.

Main price chart · unverifiedDay Trading · Swing Trading
Explore
315likes6.9Kviews9comments
Save
LevelsSignalVolatility

ADR Study [TFO]

by tradeforopp

An Average Daily Range (ADR) indicator that tracks price movement beyond daily range levels, providing insights into historical price behavior and statistical analysis of market volatility.

Main price chart · unverifiedScalping · Day Trading
Explore
280likes7.1Kviews0comments
Save
VolatilityLevels

Average Session Range [QuantVue]

by QuantVue

The Average Session Range (ASR) indicator calculates session volatility and plots dynamic support and resistance levels based on price range quartiles for precise trading insights.

Main price chart · unverifiedScalping · Day Trading
Explore
224likes4.6Kviews9comments
Save
LevelsSignalVolatility

Nick_OS Ranges

by NickMaterazzo

A trading signal that analyzes historical price ranges across different timeframes, identifying key market movement percentages and range levels for strategic trading decisions.

Main price chart · unverifiedScalping · Day Trading
Explore
43likes1.8Kviews0comments
Save
VolatilitySignal

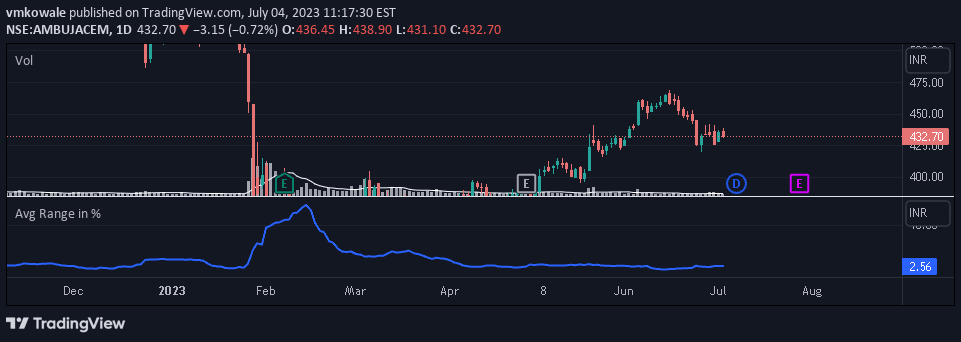
Average Range Percentage

by vaibhav1409

An indicator that calculates the average percentage range of stock/index price over N days, helping traders identify highly moving stocks for intraday trading strategies.

Separate pane · unverifiedScalping · Day Trading
Explore
36likes1.4Kviews2comments
Save
LevelsSignalVolatility

[Stop!Loss] ADR Signal

by StopLoss222

ADR Signal is a technical indicator that measures daily price range and helps traders identify potential intraday reversals and manage trading risk by tracking average price movement.

Separate pane · unverifiedScalping · Day Trading
Explore
31likes772views0comments
Save

Likes, views, and comments are historical TradingView snapshots. They describe attention, not trading performance.

START WITH A QUESTION

A little less searching.
A lot more understanding.

Tell DeepAlpha what you need. Get an explanation, a shortlist,
and a direct path to the indicators behind it.

Ask DeepAlpha