YOUR INDICATOR RESEARCH STARTS HERE

Find the right indicator.
Understand what it does.

Explore 11,183 indicators. Filter beyond the obvious.
Discover the tools that fit the way you trade.

THE INDICATOR LIBRARY

Results for “euler”

11,183 tools to explore

7 indicators matching your filters
Save search
LevelsTrendVolume

EM Visible Range Volume Profile

by EulerMethod

A technical analysis indicator that visualizes trading volume across different price levels, revealing significant market activity and potential price reversal zones.

Separate pane · unverifiedScalping · Day Trading
Explore
567likes19.9Kviews7comments
Save
TrendVolatility

SUPeR TReND 2.718

by TheLeadingIndicator

SUPeR TReND 2.718 is an advanced Supertrend indicator using Euler's constant, providing precise trend detection with dynamic visual layers and customizable trend tracking.

Main price chart · unverifiedDay Trading · Swing Trading
Explore
479likes9.2Kviews0comments
Save
TrendMomentum

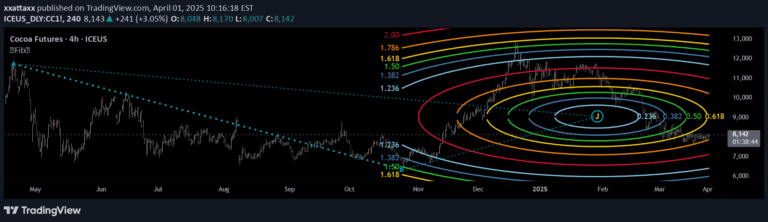
Fibonacci Circle Zones

by xxattaxx

Fibonacci Circle Zones is a technical visualization tool that uses geometric circles to analyze price-time relationships, projecting potential support and resistance zones using advanced mathematical formulas.

Main price chart · unverifiedSwing Trading
Explore
185likes2.7Kviews1comments
Save
SignalLevels

Exponential Grid [Phi, Pi, Euler]

by fract

A unique grid trading method using mathematical constants like phi to generate price levels, creating a systematic approach to identifying potential trading zones based on exponential grid expansion.

Main price chart · unverifiedDay Trading · Swing Trading
Explore
151likes5.2Kviews8comments
Save

Likes, views, and comments are historical TradingView snapshots. They describe attention, not trading performance.

START WITH A QUESTION

A little less searching.
A lot more understanding.

Tell DeepAlpha what you need. Get an explanation, a shortlist,
and a direct path to the indicators behind it.

Ask DeepAlpha