YOUR INDICATOR RESEARCH STARTS HERE

Find the right indicator.
Understand what it does.

Explore 11,183 indicators. Filter beyond the obvious.
Discover the tools that fit the way you trade.

THE INDICATOR LIBRARY

Results for “even”

11,183 tools to explore

101 indicators matching your filters
Save search
TrendMomentumEditor’s pick

Divergence for Many Indicators v4

by LonesomeTheBlue

Advanced trading tool that detects divergences across multiple technical indicators, helping traders identify potential trend reversals and momentum shifts through comprehensive pivot point analysis.

Main price chartDay Trading · Swing Trading
Explore
23.6Klikes661Kviews695comments

Save
TrendSignalChannels

Linear Regression Channel

by ChartPrime

A comprehensive technical analysis tool that uses linear regression to plot channels, bands, and future price projections, helping traders identify trends, potential reversals, and market dynamics.

Main price chart · unverifiedScalping · Day Trading
Explore
7.2Klikes92.2Kviews29comments
Save
TrendMomentumEditor’s pick

STD-Filtered, N-Pole Gaussian Filter [Loxx]

by loxx

A generalized Gaussian filter that smooths price data with variable pole orders, reducing noise and high-frequency market movements using advanced signal processing techniques.

Main price chart · unverifiedDay Trading · Swing Trading
Explore
5.8Klikes162Kviews50comments
Save
LevelsSignalTrend

Trend Lines [LuxAlgo]

by LuxAlgo

A dynamic trendline indicator that detects and highlights support/resistance lines in real-time, with customizable filters for angle, length, and break detection across different market conditions.

Main price chart · unverifiedScalping · Day Trading
Explore
4.9Klikes131.7Kviews13comments
Save
VolumeTrendEditor’s pick

Rolling VWAP

by TradingView

Rolling Volume-Weighted Average Price (RVWAP) is a dynamic indicator that calculates a moving average price weighted by volume across a flexible time window, adapting to different chart timeframes.

Main price chart · unverifiedDay Trading · Swing Trading
Explore
3.9Klikes124.1Kviews74comments
Save
LevelsSignal

Quarterly Earnings

by finallynitin

A TradingView script that displays quarterly earnings per share and sales data with year-on-year percentage changes, offering customizable visualization of financial performance metrics.

Main price chart · unverifiedSwing Trading
Explore
3.7Klikes44.7Kviews66comments
Save
TrendEditor’s pick

Stepped trailing strategy example

by adolgov

A trailing exit strategy with multiple profit targets that dynamically adjusts stop loss levels as price moves, designed to optimize trade management and protect potential gains.

Main price chart · unverifiedSwing Trading
Explore
2.6Klikes55.3Kviews52comments
Save
TrendEditor’s pick

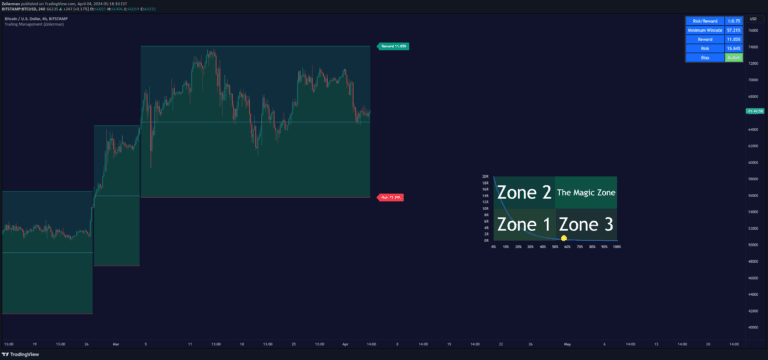
Trailing Management (Zeiierman)

by Zeiierman

An advanced trading indicator that dynamically manages trailing stops, calculates break-even points, and helps traders optimize risk-reward strategies across different market conditions.

Main price chart · unverifiedDay Trading · Swing Trading
Explore
2.5Klikes80.9Kviews39comments
Save
OscillatorSignalTrend

Seasonality Chart [LuxAlgo]

by LuxAlgo

A tool that reveals seasonal price variations by calculating average price changes for specific days across multiple years, helping traders identify recurring market patterns.

Separate pane · unverifiedSwing Trading
Explore
2.2Klikes47.7Kviews7comments
Save
MomentumOscillatorVolume

Asset Rotation Aperture

by ColeGarner

Asset Rotation Aperture tracks volume accumulation across multiple assets, visualizing capital rotation and market narratives through normalized cumulative volume lines.

Separate pane · unverifiedScalping · Day Trading
Explore
1.5Klikes19.1Kviews30comments
Save

Likes, views, and comments are historical TradingView snapshots. They describe attention, not trading performance.

START WITH A QUESTION

A little less searching.
A lot more understanding.

Tell DeepAlpha what you need. Get an explanation, a shortlist,
and a direct path to the indicators behind it.

Ask DeepAlpha