YOUR INDICATOR RESEARCH STARTS HERE

Find the right indicator.
Understand what it does.

Explore 11,183 indicators. Filter beyond the obvious.
Discover the tools that fit the way you trade.

THE INDICATOR LIBRARY

Results for “exceptional”

11,183 tools to explore

20 indicators matching your filters
Save search
LevelsSignalVolume

High Volume Points [BigBeluga]

by BigBeluga

A volume-based indicator that highlights key liquidity zones by detecting high-volume pivots and visualizing market activity through dynamic markers and support/resistance levels.

Main price chart · unverifiedScalping · Day Trading
Explore
4Klikes80.1Kviews77comments
Save
TrendMomentumOscillator

Osmosis [ChartPrime]

by ChartPrime

Osmosis is a multi-indicator heatmap that visualizes market trends across different time periods, revealing potential trend reversals and significant market movements.

Separate pane · unverifiedScalping · Day Trading
Explore
1.5Klikes35.1Kviews20comments
Save
MomentumSignalTrend

Heiken Ashi Supertrend ADX

by RohanSmith

A comprehensive trading strategy using Heiken Ashi candles, Supertrend, and ADX to identify strong trend movements with advanced risk management techniques.

Main price chart · unverifiedSwing Trading
Explore
641likes11.2Kviews3comments
Save
MomentumSignalTrend

RS - Relative Strength Score

by Lantzwat

Relative strength measures a stock's price performance compared to a market index, revealing how an asset performs relative to a benchmark over a specific time period.

Separate pane · unverifiedDay Trading · Swing Trading
Explore
503likes11Kviews6comments
Save
OscillatorSignalVolume

Enhanced Volume by SR7

by SidRC007

An advanced volume indicator that provides detailed volume analysis with color-coded volume bars, moving average insights, and unique volume labeling for comprehensive market trend assessment.

Separate pane · unverifiedScalping · Day Trading
Explore
308likes5.6Kviews5comments
Save
TrendSignal

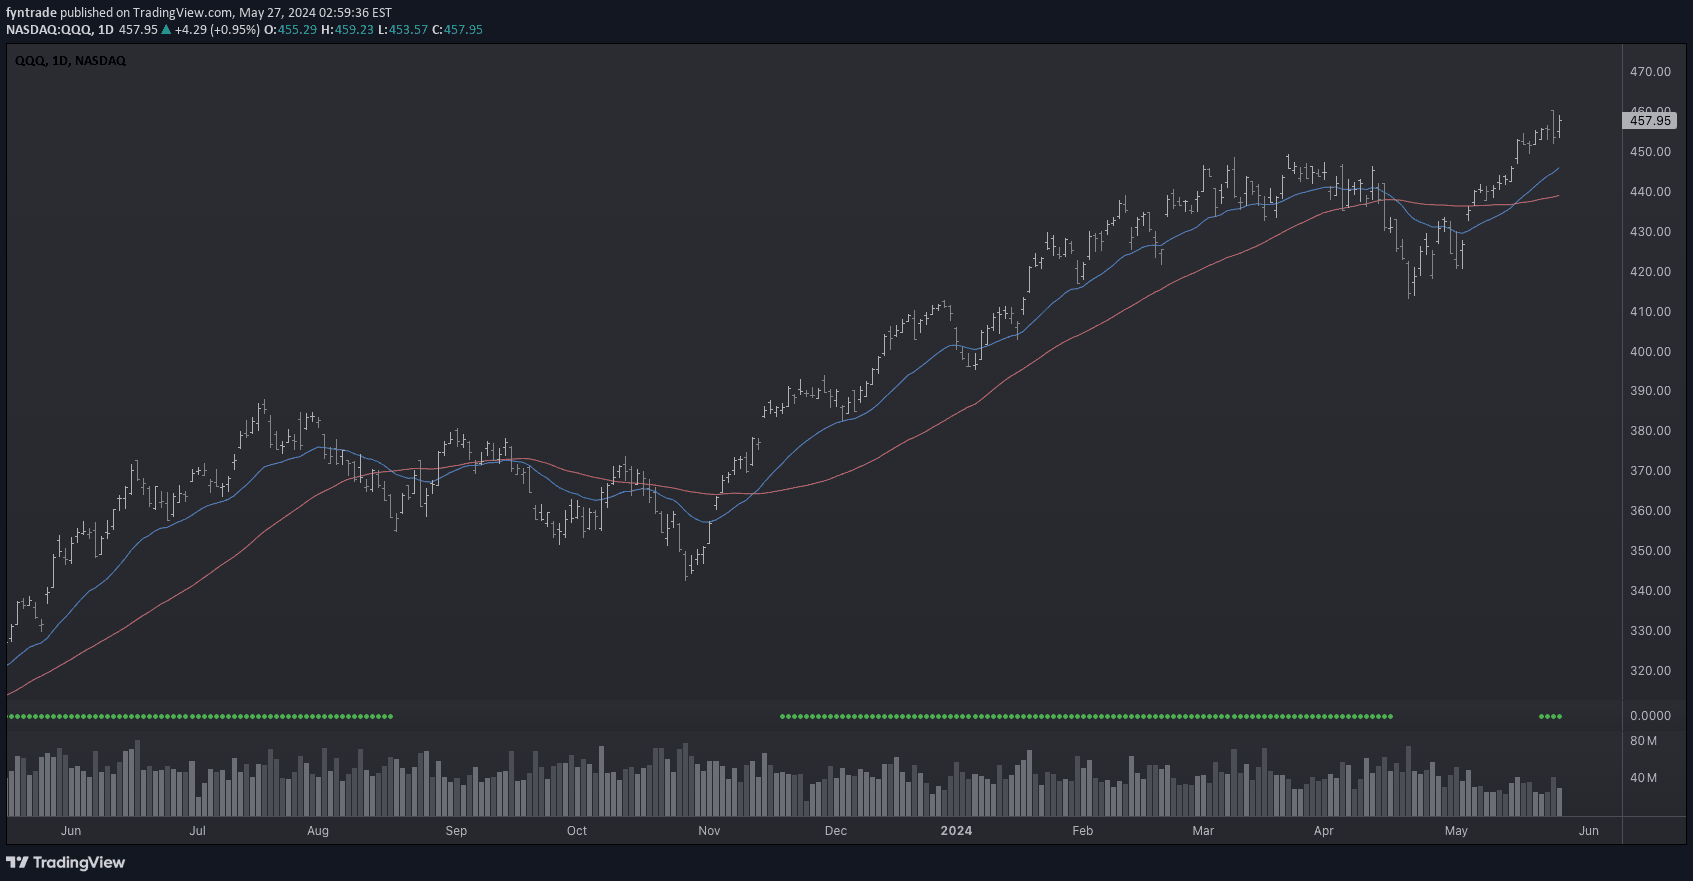
IBD PowerTrend

by fyntrade

IBD PowerTrend is a market trend indicator that identifies strong uptrends by analyzing moving averages and market conditions to help traders recognize optimal entry points.

Separate pane · unverifiedSwing Trading
Explore
237likes4.7Kviews3comments
Save
OscillatorSignalVolume

Freak Volume

by UniqueCharts

Freak Volume identifies exceptional trading volume bars by analyzing mean volume and standard deviations, highlighting potential significant market activity and turning points.

Separate pane · unverifiedScalping · Day Trading
Explore
224likes3.1Kviews7comments
Save
OscillatorVolume

Relative Volume Index [PhenLabs]

by PhenLabs

The Relative Volume Index analyzes real-time trading volume against historical averages, helping traders identify unusual market activity and potential trading opportunities through advanced volume analysis.

Separate pane · unverifiedScalping · Day Trading
Explore
138likes2.7Kviews6comments
Save
SignalVolume

Volume Insignts Analyzer

by PrasadJoshi12

An advanced volume analysis tool that detects volume dry-ups, pocket pivots, and provides comprehensive volume insights to help traders identify potential trading opportunities.

Separate pane · unverifiedScalping · Day Trading
Explore
100likes2.3Kviews1comments
Save

Likes, views, and comments are historical TradingView snapshots. They describe attention, not trading performance.

START WITH A QUESTION

A little less searching.
A lot more understanding.

Tell DeepAlpha what you need. Get an explanation, a shortlist,
and a direct path to the indicators behind it.

Ask DeepAlpha