DTFX Algo Zones [LuxAlgo]
Auto-generated Fibonacci Retracements that identify market structure shifts and potential support/resistance zones based on technical breaks and price action dynamics.
Explore 11,183 indicators. Filter beyond the obvious.
Discover the tools that fit the way you trade.
11,183 tools to explore
Auto-generated Fibonacci Retracements that identify market structure shifts and potential support/resistance zones based on technical breaks and price action dynamics.
An FX market indicator that segments trading times into specific zones, providing visual guidance for traders using timeframes of 60 minutes or less.
A customizable market session tracker displaying trading hours for Tokyo, London, New York, and Sydney with multiple visualization options and advanced trading insights.
A market structure indicator that identifies trend reversals and continuations by tracking protected highs and lows, helping traders recognize significant price movement shifts.
A liquidity indicator that identifies potential market order zones by mapping swing highs and lows, revealing where stop-loss orders and significant liquidity pools are likely positioned.
Super Pivots is a versatile indicator that displays pivot points across multiple timeframes, helping traders identify key market levels and potential trading opportunities.
A predictive indicator that estimates maximum and minimum price levels within a specified trading session, providing support/resistance insights and hit rate probabilities for traders.
A specialized price tracking indicator displaying previous day, week, and month's high and low price levels, adaptable across different timeframes to help traders identify key historical price reference points.
A timing-based indicator that displays key market session ranges, including Asia, London, and New York sessions, with customizable boxes and price level references for intraday trading analysis.
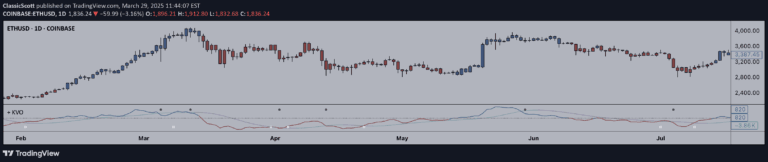
The Klinger Oscillator is a volume-based technical indicator that compares price changes and volume to determine potential trend reversals and market momentum.
A volatility indicator using Z-Score to measure market volatility relative to its mean, helping traders distinguish between trending and consolidating market conditions.
An advanced support and resistance indicator that dynamically identifies key price levels using multi-timeframe analysis and volume confirmation, with automatic role reversal capabilities.
Likes, views, and comments are historical TradingView snapshots. They describe attention, not trading performance.