Ghost Tangent Crossings [ChartPrime]
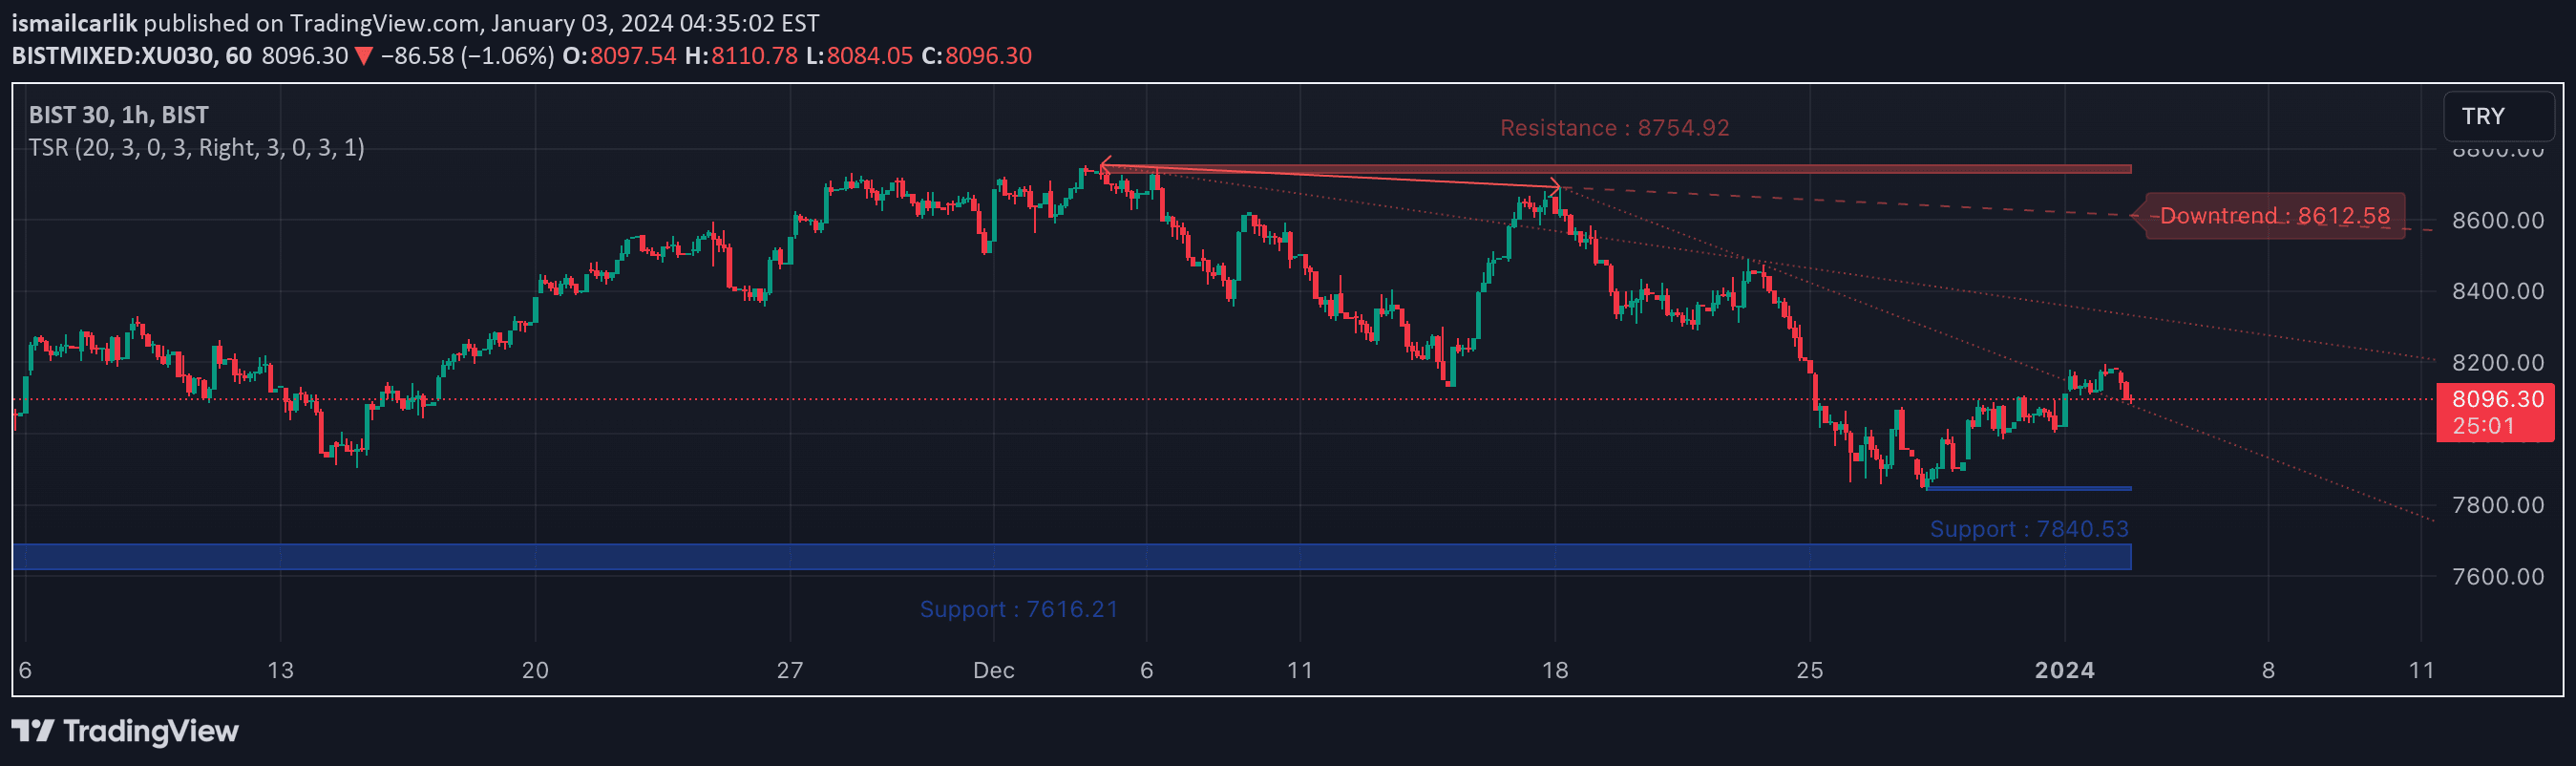
Ghost Tangent Crossings is an innovative pivot point indicator that visualizes market movements using ellipses, dynamically tracking zig-zag patterns and potential price breakouts.
Explore 11,183 indicators. Filter beyond the obvious.
Discover the tools that fit the way you trade.
11,183 tools to explore
Ghost Tangent Crossings is an innovative pivot point indicator that visualizes market movements using ellipses, dynamically tracking zig-zag patterns and potential price breakouts.
A sophisticated momentum oscillator using windowed sinc low pass filter to generate smoother, more accurate rate of change analysis with advanced visualization features.
A Pine Script tool for drawing dynamic trend lines, support, and resistance levels by analyzing pivot points. Helps traders identify potential price movement patterns and breakout opportunities.
A comprehensive moving average indicator with multiple configuration options, featuring three advanced moving averages that can be customized with various inputs and visualization settings.
A dynamic pivot indicator that estimates monthly pivot levels in real-time using current high, low, and close prices, helping traders anticipate potential support and resistance zones.
A unique volume-based indicator that dynamically adjusts candle transparency to highlight market activity, making high-volume candles more prominent while low-volume candles fade into the background.
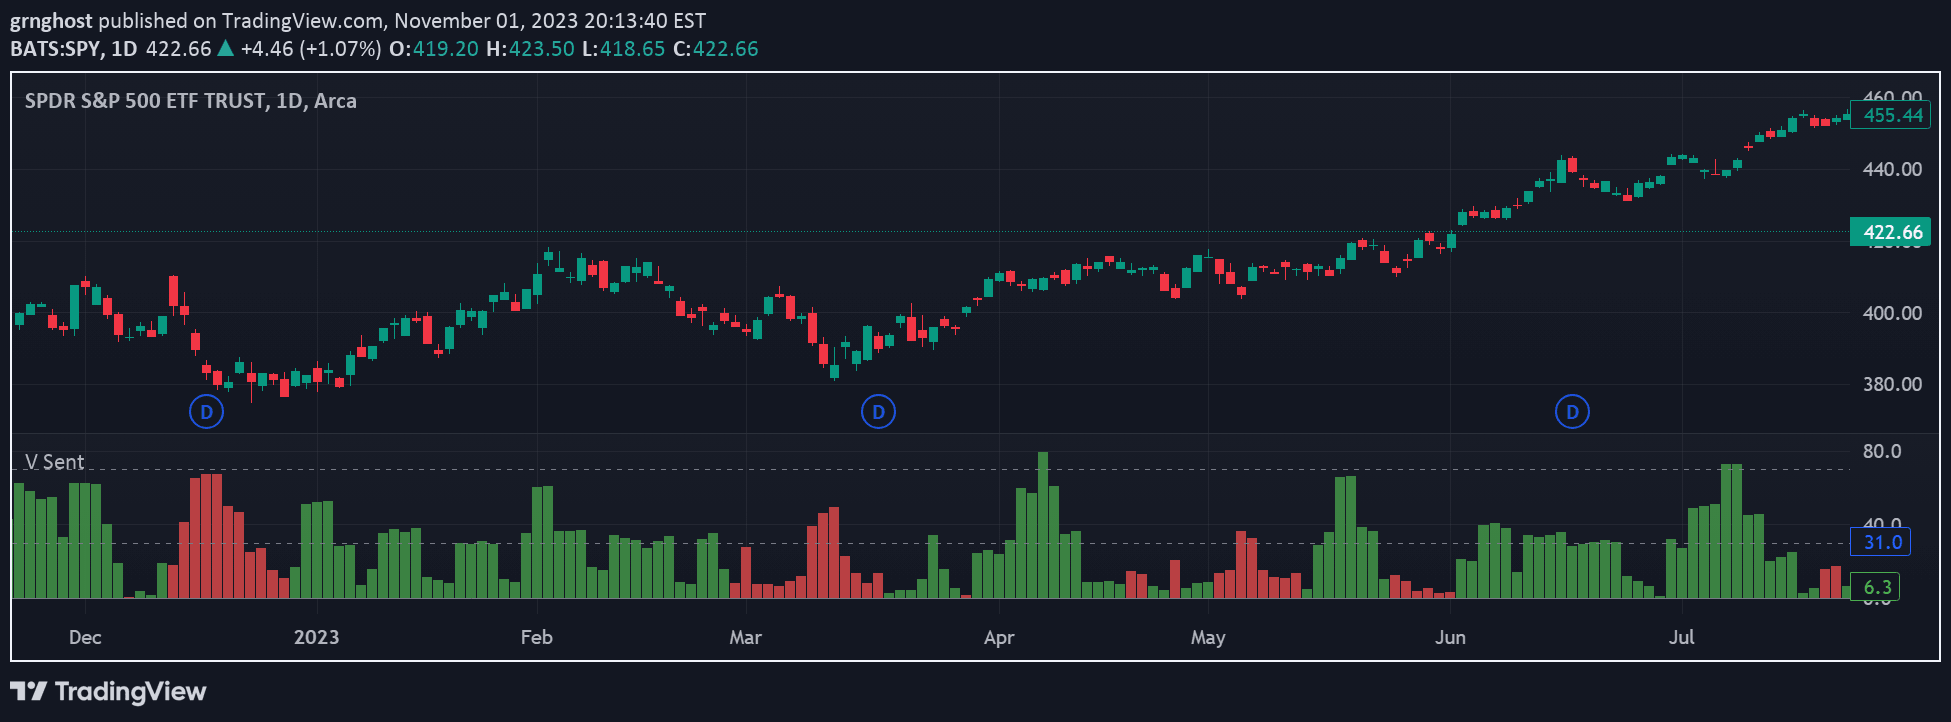
A volume-based trading indicator that measures bar sentiment by analyzing the relationship between a bar's low, close, and volume to determine bullish or bearish market conditions.
A custom trend indicator using Donchian Channels across multiple timeframes to generate a smooth trend line that helps identify market direction and potential trading opportunities.
A multi-timeframe Bollinger Bands indicator that automatically draws support and resistance lines across different time frames to simplify chart analysis.
A Donchian Channel-based oscillator that transforms complex channel data into a percentage metric, offering trend insights through simplified visual representation.
Advanced Sharpe Ratio indicator with dynamic upper and lower bands that measure risk-adjusted returns and help traders identify extreme performance levels.
A trailing stop indicator that dynamically adjusts stop levels based on recent price movements and volatility, helping traders manage risk and protect potential profits.
Likes, views, and comments are historical TradingView snapshots. They describe attention, not trading performance.