YOUR INDICATOR RESEARCH STARTS HERE

Find the right indicator.
Understand what it does.

Explore 11,183 indicators. Filter beyond the obvious.
Discover the tools that fit the way you trade.

THE INDICATOR LIBRARY

Results for “golden”

11,183 tools to explore

67 indicators matching your filters
Save search
TrendMomentumEditor’s pick

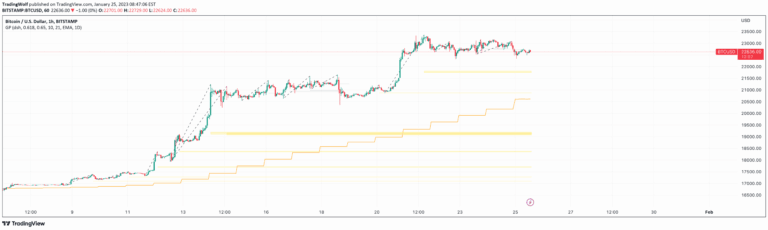
Golden Pocket

by TradingWolf

Golden Pocket is a Fibonacci retracement tool that identifies key price levels between 0.618 and 0.65, helping traders find potential entry points during market retracements.

Main price chart · unverifiedDay Trading · Swing Trading
Explore
2Klikes112.3Kviews33comments
Save
MomentumSignalTrend

Golden Swap (Zeiierman)

by Zeiierman

A trading signal that identifies potential market reversals by analyzing price symmetry, baseline boundaries, and precision pin bar formations for precise entry and exit points.

Main price chart · unverifiedScalping · Day Trading
Explore
1.9Klikes45.2Kviews14comments
Save
LevelsSignalTrend

Zigzag Fibonacci Golden Zone [UAlgo]

by UAlgo

A trading indicator that combines zigzag patterns with Fibonacci retracement levels to identify potential trend pullback points and generate buy/sell signals for market entry.

Main price chart · unverifiedDay Trading · Swing Trading
Explore
1.6Klikes44.7Kviews19comments
Save
TrendMomentumEditor’s pick

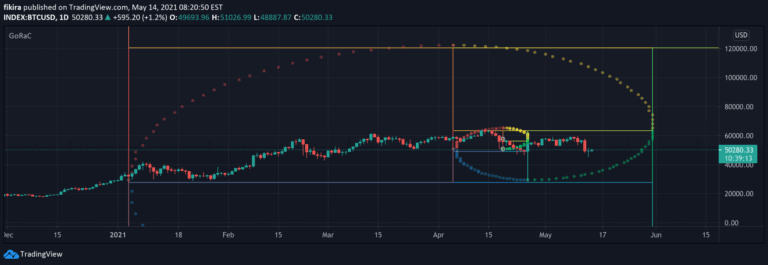
'Golden ratio' Cubes - 'GoRaC'

by fikira

A trading technique using Golden ratio cubes to analyze price differences between two points, helping identify potential support and resistance areas with multiple visualization options.

Main price chart · unverifiedDay Trading · Swing Trading
Explore
979likes29.7Kviews27comments
Save
MomentumOscillator

GOLDEN RSI by @thejamiul

by thejamiul

Advanced RSI indicator with gradient-filled zones, divergence detection, and customizable settings to help traders identify market trends, potential reversals, and trading opportunities.

Separate pane · unverifiedScalping · Day Trading
Explore
873likes10.8Kviews3comments
Save
SignalTrend

VARGAS

by bistatistics

VARGAS is a weighted moving average indicator that generates trading signals by analyzing the crossovers between 9-day and 15-day moving averages across different markets.

Main price chart · unverifiedDay Trading · Swing Trading
Explore
835likes10.9Kviews11comments
Save

Likes, views, and comments are historical TradingView snapshots. They describe attention, not trading performance.

START WITH A QUESTION

A little less searching.
A lot more understanding.

Tell DeepAlpha what you need. Get an explanation, a shortlist,
and a direct path to the indicators behind it.

Ask DeepAlpha