
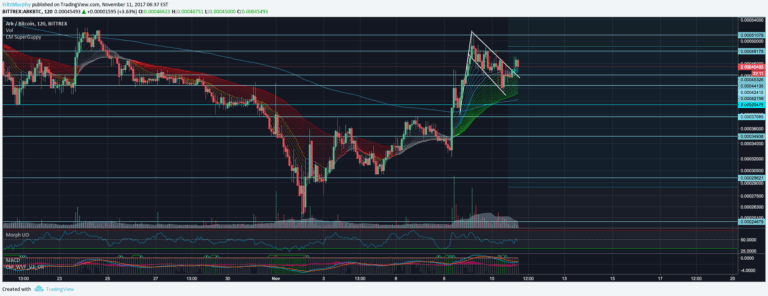
CM Super Guppy
An enhanced Exponential Moving Average (EMA) script based on the Super Guppy format, designed to provide advanced trend analysis by utilizing multiple EMA lengths for comprehensive market insights.
Explore 11,183 indicators. Filter beyond the obvious.
Discover the tools that fit the way you trade.
11,183 tools to explore
An enhanced Exponential Moving Average (EMA) script based on the Super Guppy format, designed to provide advanced trend analysis by utilizing multiple EMA lengths for comprehensive market insights.
The GMMA Toolkit analyzes market trends using two sets of exponential moving averages, creating visual clouds and an oscillator to identify trend strength and potential reversals.
Kernel Regression Ribbon is an advanced trend identification tool using multiple kernel regressions to visualize support, resistance, and price movement adaptively.
A trendline-based trading indicator that draws pivot point trendlines and uses GMMA arrows to confirm trend direction, helping traders identify potential entry and exit points.
The Guppy Wave Indicator uses 12 Moving Averages to assess market strength and short-term momentum through a color-coded gradient visualization.
A relative strength indicator that compares a stock's performance against an index by dividing their prices and plotting the GMMA to analyze trend strength and potential outperformance.
A multi-length moving average indicator with color-coded gradient themes that helps traders quickly visualize trend direction, support/resistance levels, and potential market reversals.
GMMA is a technical analysis tool using multiple moving averages to identify price trends, entry and exit points, and potential price reversals across different market conditions.
Cumulative Ease of Movement tracks price efficiency relative to volume, helping traders understand sustained buying or selling pressure through a unique directional bias accumulation method.
The GMMA Momentum Indicator uses 12 exponential moving averages to analyze market trends, momentum, and potential trading signals by comparing short-term and long-term trader sentiments.
A powerful trading indicator combining Guppy Multiple Moving Averages and Bollinger Bands to identify trend direction, market sentiment, and potential entry points during price movements.
Daryl Guppy's Average Daily Range indicator estimates the potential price range for the next trading day using historical range data with high probability projection.
Likes, views, and comments are historical TradingView snapshots. They describe attention, not trading performance.