YOUR INDICATOR RESEARCH STARTS HERE

Find the right indicator.
Understand what it does.

Explore 11,183 indicators. Filter beyond the obvious.
Discover the tools that fit the way you trade.

THE INDICATOR LIBRARY

Results for “hedge”

11,183 tools to explore

16 indicators matching your filters
Save search
SignalTrend

Mxwll Hedge Suite [Mxwll]

by MXWLL-Capital-Trading

A trading tool that identifies the best negatively correlated asset for hedging by analyzing price correlations across different cryptocurrencies and determining precise hedge quantities.

Separate pane · unverifiedScalping · Day Trading
Explore
129likes5.1Kviews4comments
Save
TrendVolume

Hui-Heubel Liquidity Ratio

by potato_hedge

The Hui-Heubel Liquidity Ratio measures market resiliency and liquidity, indicating market fragility or strength through volume and price interactions.

Separate pane · unverifiedDay Trading · Swing Trading
Explore
80likes5.6Kviews0comments
Save
MomentumOscillatorTrend

NOMMO AUTOMATE

by NOMMOiO

NOMMO AUTOMATE is an advanced trend detection indicator using RSI and HMA to identify trend changes, impulses, and potential trading opportunities across multiple timeframes.

Separate pane · unverifiedDay Trading · Swing Trading
Explore
63likes2Kviews2comments
Save
TrendSignal

TTP Pair Slope/Hedge

by TheTradingParrot

A pair slope/hedge technique using linear regression to calculate the relationship between two assets, helping identify potential cointegration and trading opportunities.

Separate pane · unverifiedDay Trading · Swing Trading
Explore
57likes2.5Kviews6comments
Save
SignalTrend

Color Hull Moving Average

by SonicTheHedgehog

The Color Hull Moving Average is a dynamic trend indicator that smooths price data and changes color to visually represent market direction, helping traders identify trend shifts quickly.

Main price chart · unverifiedScalping · Day Trading
Explore
55likes1.9Kviews3comments
Save
SignalVolatility

Sortino Ratio

by Kian_123456

A risk-adjusted performance indicator that measures an asset's returns by focusing specifically on downside risk, helping traders assess performance relative to negative price movements.

Separate pane · unverifiedDay Trading · Swing Trading
Explore
28likes1.1Kviews1comments
Save
TrendVolatilitySignal

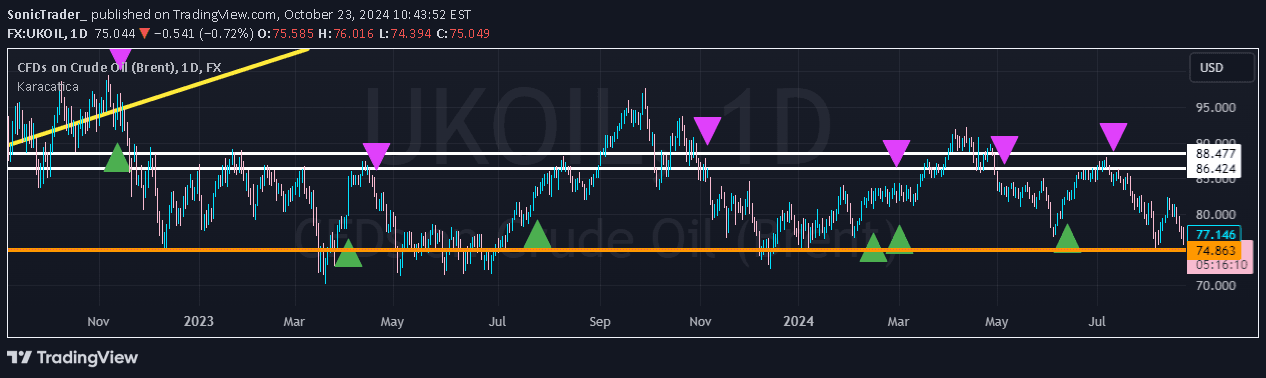
Karacatica

by SonicTheHedgehog

A dynamic trend-following indicator that combines Average True Range and Directional Indicators to generate precise buy and sell signals based on market direction and strength.

Main price chart · unverifiedScalping · Day Trading
Explore
25likes681views0comments
Save
SignalLevels

Covered Call Visual

by oldinvestor

A trading technique visualizing key price levels for covered call options, displaying max profit, entry price, strike price, and break-even points between specified dates.

Main price chart · unverifiedSwing Trading
Explore
21likes520views0comments
Save
TrendSignal

Previous Day High/Low ±0.5%

by Defremov

A trading strategy designed to help hedge a strategic portfolio by generating buy and sell signals based on daily price action and predefined lines on the chart.

Main price chart · unverifiedSwing Trading
Explore
16likes827views0comments
Save

Likes, views, and comments are historical TradingView snapshots. They describe attention, not trading performance.

START WITH A QUESTION

A little less searching.
A lot more understanding.

Tell DeepAlpha what you need. Get an explanation, a shortlist,
and a direct path to the indicators behind it.

Ask DeepAlpha