
YOUR INDICATOR RESEARCH STARTS HERE

Find the right indicator.
Understand what it does.

Explore 11,183 indicators. Filter beyond the obvious.
Discover the tools that fit the way you trade.

THE INDICATOR LIBRARY

Results for “horizontal”

11,183 tools to explore

531 indicators matching your filters
Save search
VolumeLevels

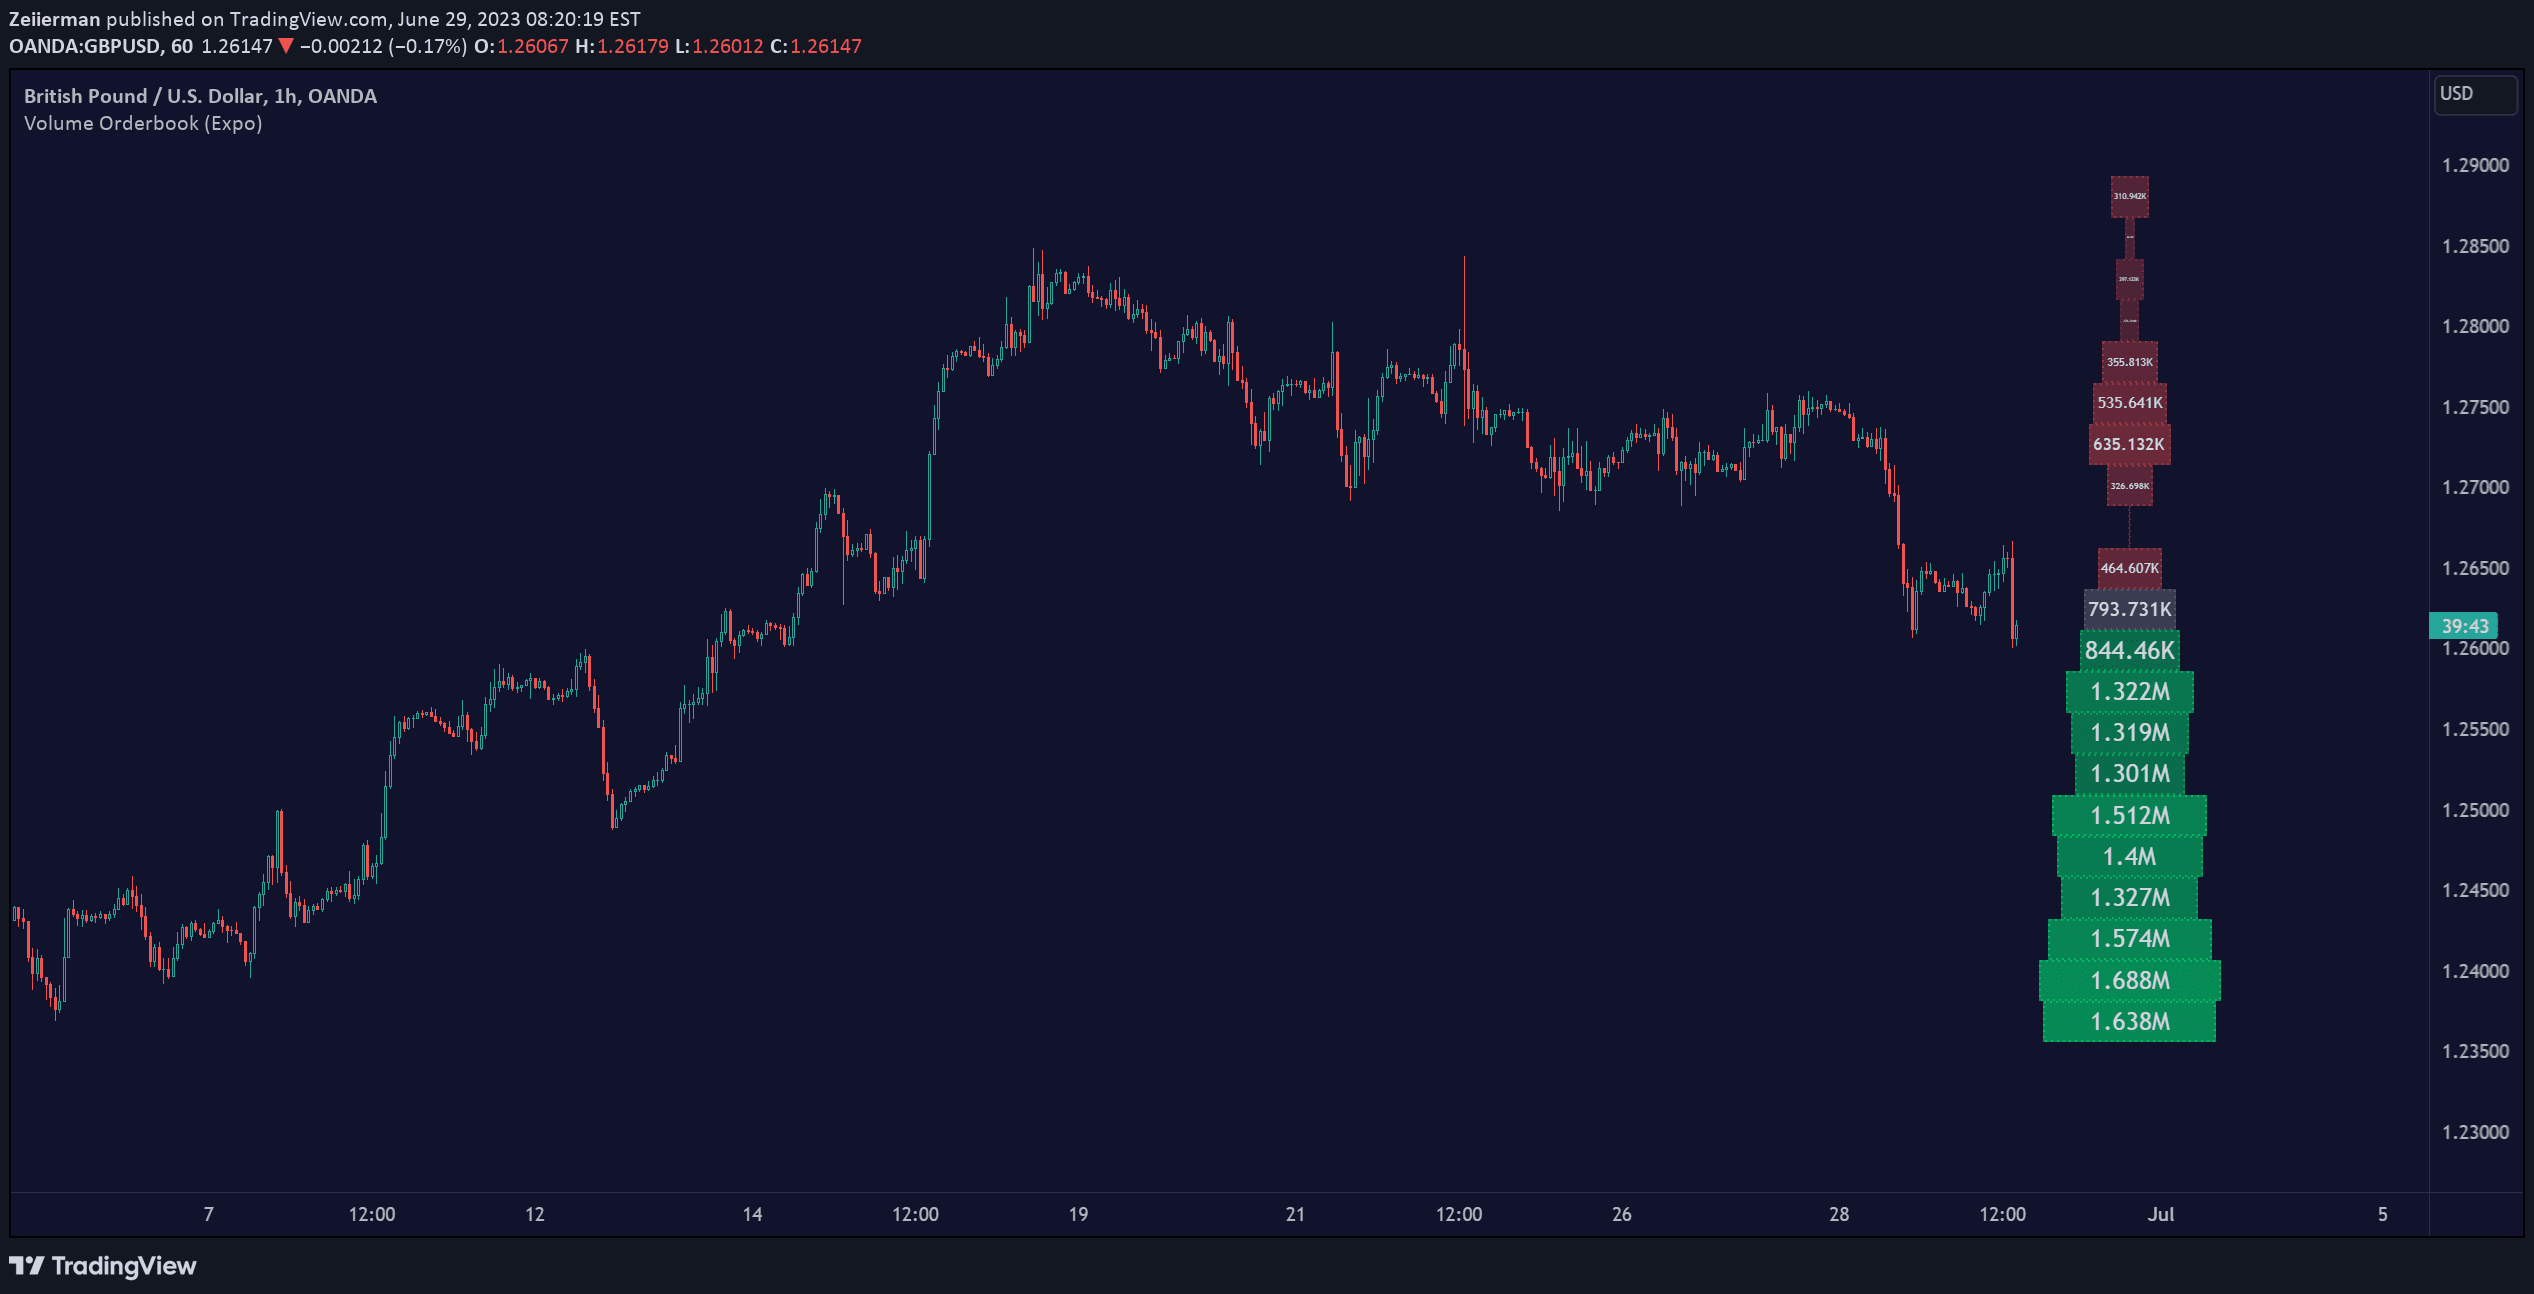
Volume Orderbook (Expo)

by Zeiierman

Volume Orderbook is a visual trading tool that displays trading volume across different price levels, helping traders identify significant market activity zones and potential support/resistance areas.

Separate pane · unverifiedScalping · Day Trading
Explore
8.4Klikes192.3Kviews127comments
Save
VolumeTrendLevelsEditor’s pick

Liquidity Price Depth Chart [LuxAlgo]

by LuxAlgo

A depth chart visualizing price liquidity by mapping bullish and bearish price variations, highlighting volume clusters and potential support/resistance zones across trading ranges.

Separate pane · unverifiedScalping · Day Trading
Explore
6.6Klikes276.8Kviews14comments
Save
TrendMomentumEditor’s pick

Fibonacci Time-Price Zones

by xxattaxx

Fibonacci Time-Price Zones is an advanced indicator that combines Fibonacci ratios with time and price analysis, offering multiple geometric visualization methods to identify market turning points.

Main price chart · unverifiedDay Trading · Swing Trading
Explore
5.2Klikes147.5Kviews33comments
Save
VolumeMomentumEditor’s pick

Indicators Overlay

by LonesomeTheBlue

A comprehensive multi-indicator script that displays various technical indicators in separate windows, allowing traders to customize and analyze market momentum, volume, and trend signals.

Separate pane · unverifiedDay Trading · Swing Trading
Explore
4.6Klikes83.3Kviews144comments
Save
LevelsTrendVolume

Price & Volume Profile (Expo)

by Zeiierman

A comprehensive market analysis tool tracking price frequency and trading volume to reveal market dynamics, support/resistance levels, and fair value zones.

Separate pane · unverifiedScalping · Day Trading
Explore
4.3Klikes86.9Kviews26comments
Save
LevelsSignalVolume

High Volume Points [BigBeluga]

by BigBeluga

A volume-based indicator that highlights key liquidity zones by detecting high-volume pivots and visualizing market activity through dynamic markers and support/resistance levels.

Main price chart · unverifiedScalping · Day Trading
Explore
4Klikes80.1Kviews77comments
Save
TrendMomentumEditor’s pick

Divergence-Support/Resistence

by Trendoscope

A trading signal that identifies support and resistance levels using zigzag patterns, divergence detection, and oscillator analysis to highlight potential trend reversals and market momentum shifts.

Main price chart · unverifiedDay Trading · Swing Trading
Explore
3.6Klikes149.2Kviews39comments
Save

Likes, views, and comments are historical TradingView snapshots. They describe attention, not trading performance.

START WITH A QUESTION

A little less searching.
A lot more understanding.

Tell DeepAlpha what you need. Get an explanation, a shortlist,
and a direct path to the indicators behind it.

Ask DeepAlpha

