Bjorgum Key Levels
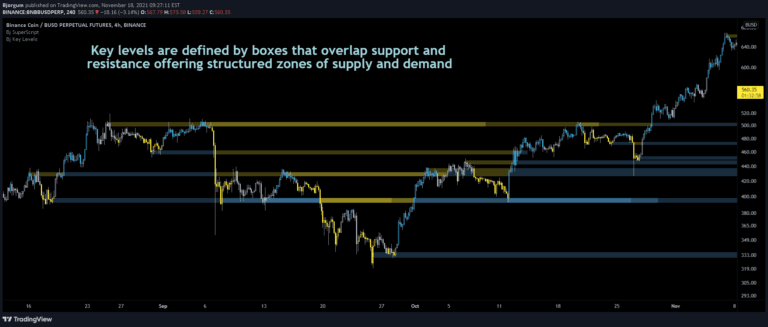
Key Levels strategy identifies critical price action points like breakouts, false breakouts, and backchecks to help traders understand market movement and potential trading opportunities.
Explore 11,183 indicators. Filter beyond the obvious.
Discover the tools that fit the way you trade.
11,183 tools to explore
Key Levels strategy identifies critical price action points like breakouts, false breakouts, and backchecks to help traders understand market movement and potential trading opportunities.
A trading indicator that identifies breaker blocks and highlights potential entry points by detecting price action around support and resistance zones with premium/discount swing levels.
An advanced trading strategy measuring the opening range of a trading session to identify potential breakout opportunities and determine market trend direction with precise entry and exit points.
The 2B reversal pattern identifies potential market trend reversals by detecting false breakouts and price rebounds, signaling opportune entry points for traders.
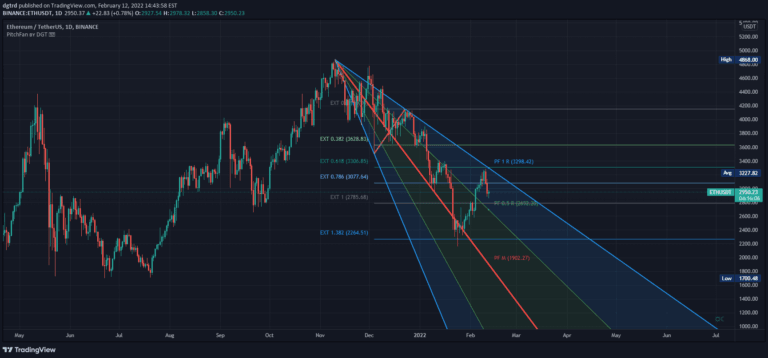
An advanced trading tool combining PitchFan, Fibonacci Extensions/Retracements, and ZigZag to identify potential support, resistance levels, and trend continuation signals.
A price action scalping sequence identifying potential breakout opportunities by detecting two unsuccessful breakouts in the same direction, anticipating a third decisive move.
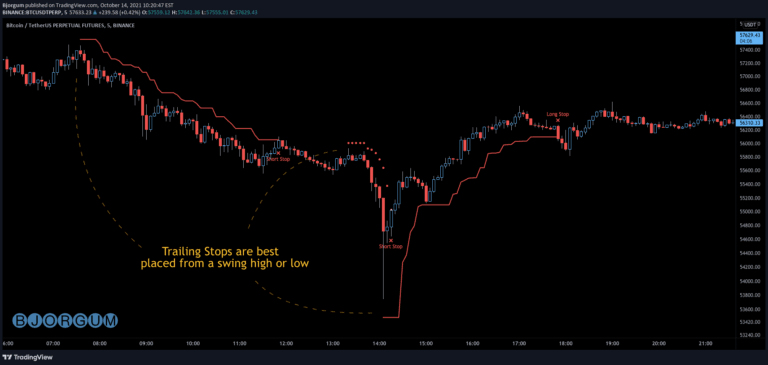
A versatile trailing stop management script for crypto and forex traders, offering multiple trail types to protect profits and manage risk dynamically during ongoing trades.
A dynamic trendline indicator that detects and highlights support/resistance lines in real-time, with customizable filters for angle, length, and break detection across different market conditions.
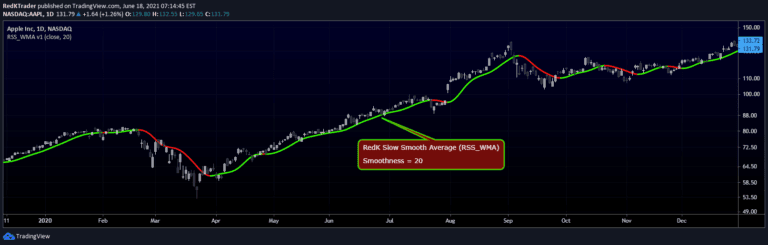
RedK Slow Smooth Average (RSS_WMA) is a specialized moving average designed to provide smooth trend visualization by filtering out short-term price noise through multiple weighted moving average passes.
ABC Pattern is a three-wave corrective trading indicator that identifies potential trend reversals and price movements by analyzing impulse and corrective waves in market trends.
A Market Profile indicator that visualizes price and volume distribution, highlighting key trading levels and providing insights into market structure through time-price opportunity (TPO) analysis.
Market Structure Trend Targets tracks trend direction by identifying breakout points, dynamic stop losses, and potential mean reversion signals for strategic trading decisions.
Likes, views, and comments are historical TradingView snapshots. They describe attention, not trading performance.