YOUR INDICATOR RESEARCH STARTS HERE

Find the right indicator.
Understand what it does.

Explore 11,183 indicators. Filter beyond the obvious.
Discover the tools that fit the way you trade.

THE INDICATOR LIBRARY

Results for “kumo”

11,183 tools to explore

6 indicators matching your filters
Save search
TrendMomentumEditor’s pick

Ichimoku Theories [LuxAlgo]

by LuxAlgo

A comprehensive Ichimoku trading tool that combines multiple theories to analyze market trends, cycles, waves, and potential price targets using advanced Japanese technical analysis techniques.

Main price chart · unverifiedSwing Trading
Explore
4.9Klikes159.9Kviews40comments
Save
MomentumOscillatorSignal

IchimokuBuy Sell With Stoch RSI

by aliyilmazov

A comprehensive trading indicator combining Ichimoku Cloud, MACD, EMA, RSI, and Stochastic RSI to generate precise buy and sell signals across different market conditions.

Main price chart · unverifiedDay Trading · Swing Trading
Explore
317likes13.1Kviews4comments
Save
SignalTrend

Renko Ichimoku Cloud

by LeafAlgo

A Renko-based Ichimoku Cloud indicator that smooths price movements and provides trend signals using standard Ichimoku components with enhanced visualization.

Main price chart · unverifiedScalping · Day Trading
Explore
175likes7.9Kviews2comments
Save
SignalTrend

Ichimoku ACE Club

by binhmyco

A comprehensive Ichimoku Cloud indicator that provides multiple trend lines and visual markers to help traders analyze market direction and potential entry/exit points.

Main price chart · unverifiedScalping · Day Trading
Explore
73likes1.4Kviews0comments
Save
SignalTrend

Simple Ichimoku Kinko Hyo Cloud

by RozaniGhani-RG

An educational Pine Script implementation showcasing user-defined types for the Ichimoku Kinko Hyo indicator, which helps traders analyze market trends and potential trading signals.

Main price chart · unverifiedScalping · Day Trading
Explore
51likes2.2Kviews0comments
Save
TrendMomentumOscillator

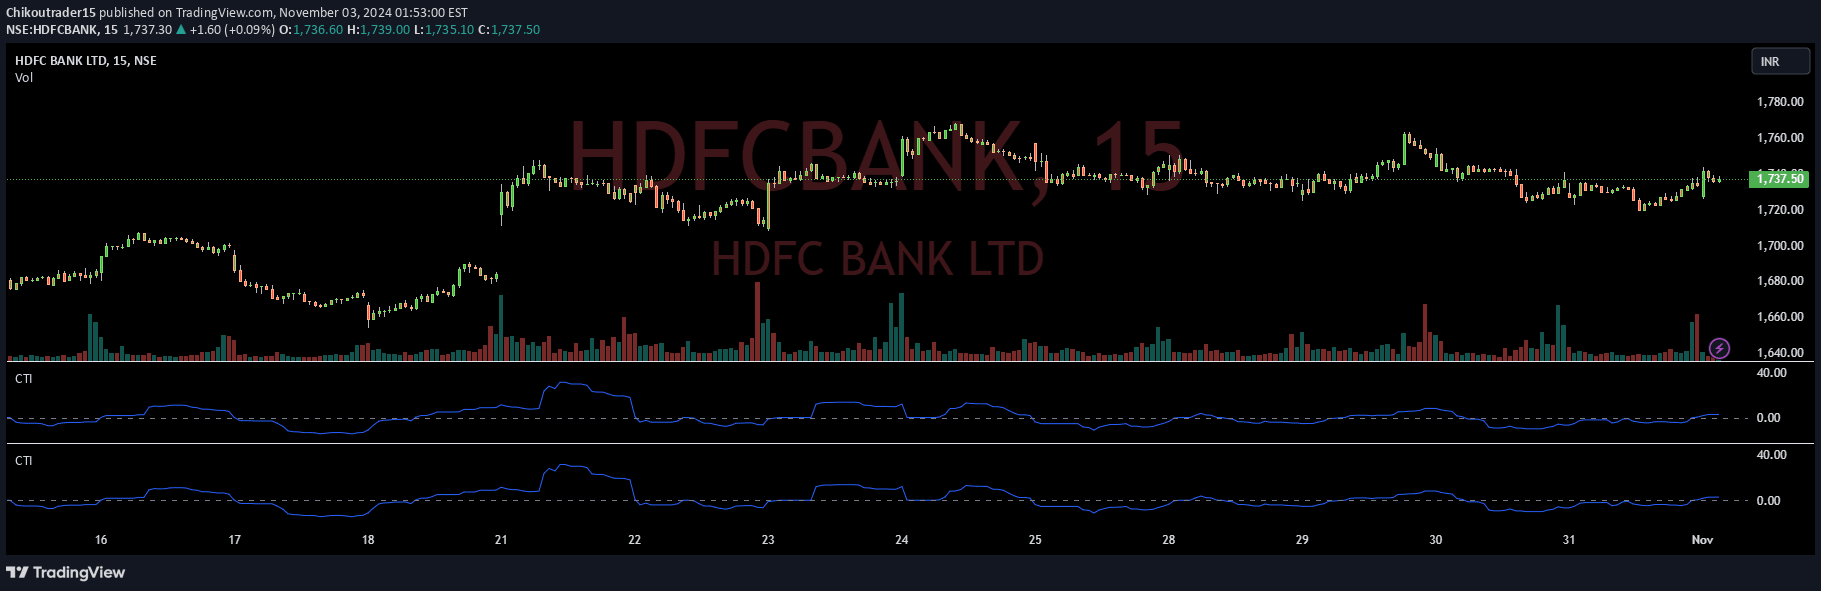
ChikouTradeIndicator

by Chikoutrader15

The ChikouTradeIndicator analyzes price range dynamics across different time periods to identify potential trend reversals and market momentum through calculated midpoint differences.

Separate pane · unverifiedScalping · Day Trading
Explore
18likes769views0comments
Save

Likes, views, and comments are historical TradingView snapshots. They describe attention, not trading performance.

START WITH A QUESTION

A little less searching.
A lot more understanding.

Tell DeepAlpha what you need. Get an explanation, a shortlist,
and a direct path to the indicators behind it.

Ask DeepAlpha