Ichimoku Kinkō hyō 目均衡表
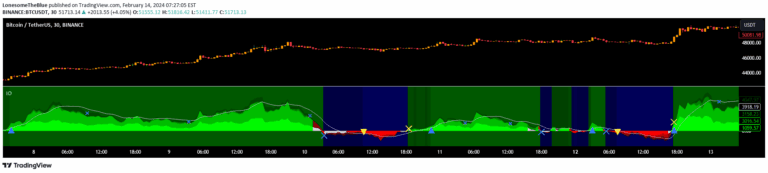
An advanced Ichimoku Kinko Hyo indicator with extensive customization options for analyzing market trends, momentum, and potential trading signals across different timeframes.
Explore 11,183 indicators. Filter beyond the obvious.
Discover the tools that fit the way you trade.
11,183 tools to explore
An advanced Ichimoku Kinko Hyo indicator with extensive customization options for analyzing market trends, momentum, and potential trading signals across different timeframes.
Ichimoku Oscillator is a multi-layered technical analysis tool that evaluates market trends using Ichimoku Cloud features, providing insights into potential entry and exit points.
A custom Donchian channel-based zig-zag indicator that tracks price extremities, offering unique insights into market movements and potential support/resistance levels.
An advanced Ichimoku-based oscillator that provides comprehensive market trend analysis by converting complex cloud components into a streamlined, color-coded momentum indicator.
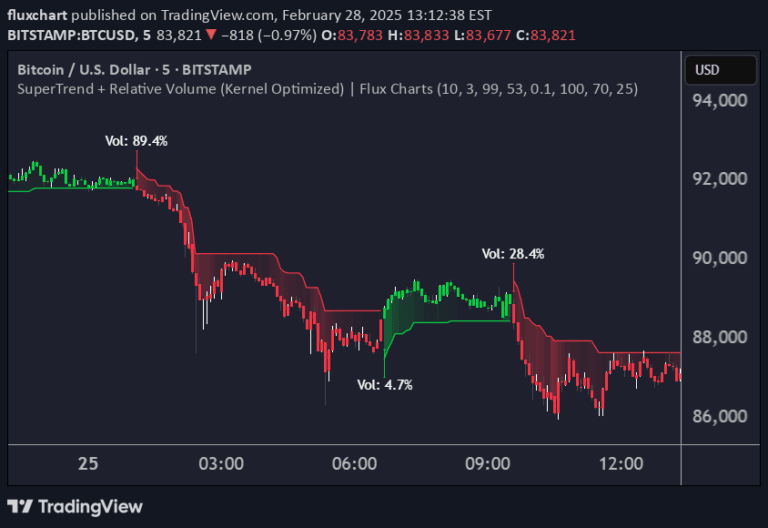
An advanced trading indicator combining Supertrend and Relative Volume using Kernel Density Estimation to predict trend breaks with probabilistic precision and volume confirmation.
A trading indicator designed to identify sideways or ranging markets by tracking significant price candles and establishing dynamic range boundaries based on price movement.
A sophisticated trading indicator that combines Kalman filter technology with RSI to provide advanced momentum analysis and trend detection with enhanced noise reduction and market responsiveness.
A predictive indicator that calculates the probability of moving average crossovers by analyzing potential future price movements and predicting MA interactions before they occur.
A zero-lag indicator developed by John F. Ehlers combining Reflex and Trendflex components to reduce signal lag and provide more sensitive trend and cycle analysis.
Advanced RSI indicator using linear regression to forecast future RSI movements, providing predictive insights into market momentum and potential trend reversals.
Flying Dragon Trend is a dynamic trend indicator that uses multiple moving averages and offset techniques to identify potential trend pivots across different timeframes.
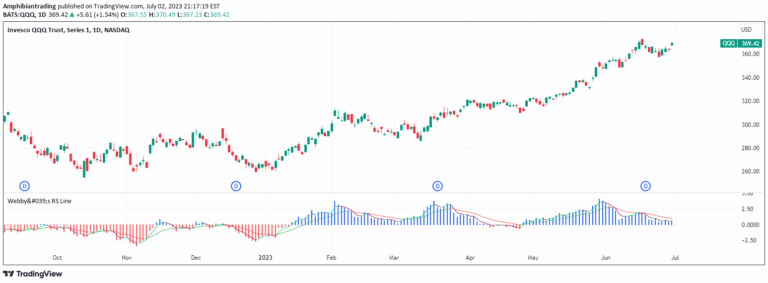
A relative strength indicator that compares a stock's performance against the S&P 500 using low prices and exponential moving averages to identify momentum shifts.
Likes, views, and comments are historical TradingView snapshots. They describe attention, not trading performance.