3x Supertrend + EMA200 Signal Buy/Sell [nsen]
A trading signal combining three Supertrend lines and an EMA to generate buy and sell decisions based on trend direction and moving average positioning.
Explore 11,183 indicators. Filter beyond the obvious.
Discover the tools that fit the way you trade.
11,183 tools to explore
A trading signal combining three Supertrend lines and an EMA to generate buy and sell decisions based on trend direction and moving average positioning.
A Fibonacci-based trading indicator that maps price zones using day open price, moving averages, and Fibonacci levels to help traders identify market trends and potential trade entry points.
An advanced moving average tool featuring multiple SMA periods with a dynamic 200-period MA that changes color and can be locked to the daily timeframe for comprehensive trend analysis.
A powerful trading indicator combining SMA200 and RSI to identify potential bullish entry zones by analyzing market trend and momentum in a single signal.
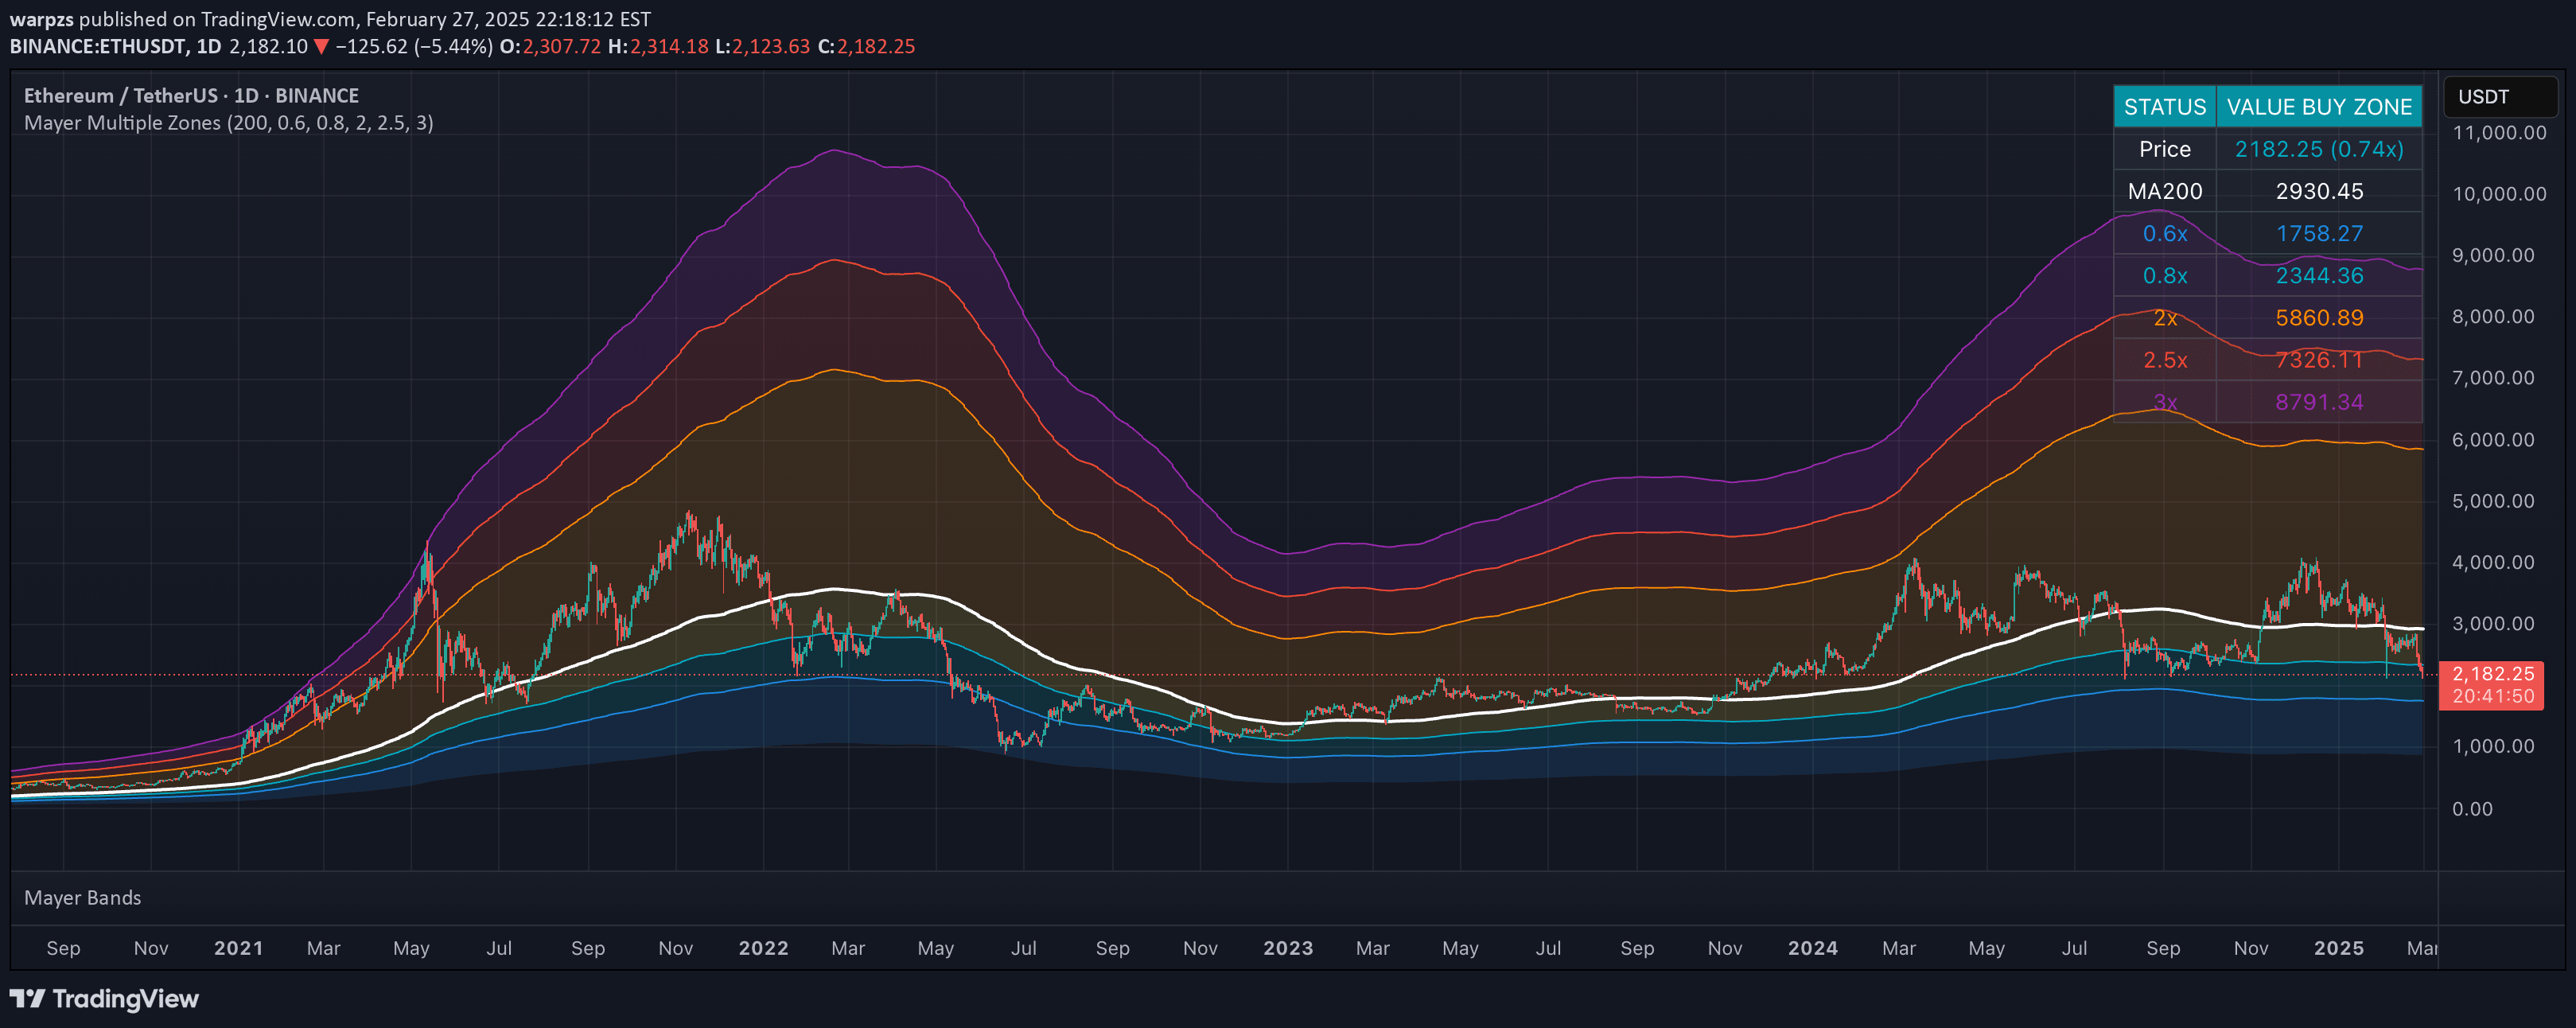
An advanced crypto valuation indicator that identifies price zones relative to MA200 and provides market context through ETH/BTC ratio analysis for strategic trading decisions.
A trading signal that checks daily chart conditions including price positioning relative to previous year close and long-term moving average to identify potential upward momentum.
A 2-minute chart indicator that identifies key price zones, trap areas, and expansion levels for precise market entry and exit points for intraday traders.
A market valuation indicator using the 200-period moving average to categorize price into strategic zones, helping traders identify potential buying and selling opportunities.
Multiple MAs is a comprehensive trend analysis tool that overlays six Simple Moving Averages on a price chart, helping traders identify trend direction, support/resistance levels, and potential entry/exit points.
Likes, views, and comments are historical TradingView snapshots. They describe attention, not trading performance.