Optimized Trend Tracker
Optimized Trend Tracker (OTT) is an advanced indicator designed to identify market trend direction and provide clear buy and sell signals based on price movements relative to the indicator line.
Explore 11,183 indicators. Filter beyond the obvious.
Discover the tools that fit the way you trade.
11,183 tools to explore
Optimized Trend Tracker (OTT) is an advanced indicator designed to identify market trend direction and provide clear buy and sell signals based on price movements relative to the indicator line.
CM MACD Ultimate Multi-Timeframe V2 is an advanced MACD indicator with enhanced customization options, multi-timeframe analysis, and comprehensive trend visualization features.
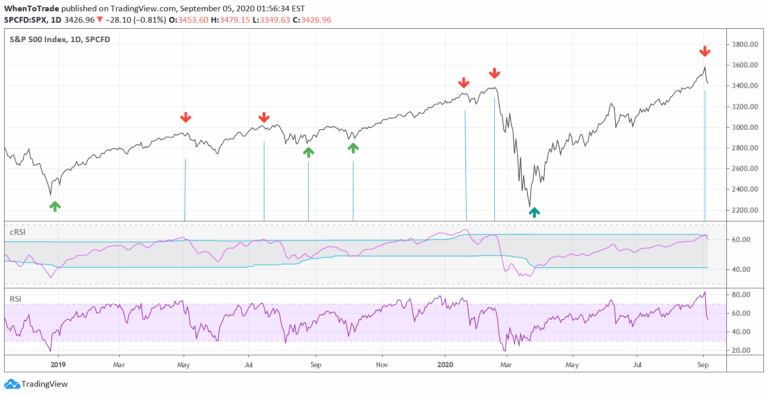
An enhanced RSI indicator that uses cyclic smoothing and adaptive bands to provide more responsive market trend signals by incorporating dominant cycle length.
An advanced trading indicator that identifies trendline breakouts and breakdowns, providing precise entry signals, target calculations, and visual trade management tools.
An advanced trading strategy measuring the opening range of a trading session to identify potential breakout opportunities and determine market trend direction with precise entry and exit points.
The 2B reversal pattern identifies potential market trend reversals by detecting false breakouts and price rebounds, signaling opportune entry points for traders.
The RMI Trend Sniper is a sophisticated trend-following indicator that combines RSI and MFI to generate momentum signals and identify potential market trend reversals.
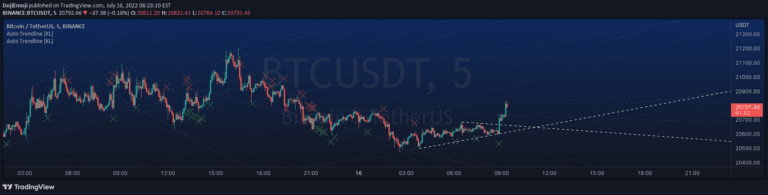
An automated tool that systematically draws trend lines by connecting recent fractals, helping traders identify potential price action patterns without subjective manual drawing.
A multi-timeframe support and resistance indicator that identifies key price zones, tracks breaks and retests, and provides comprehensive market trend analysis for traders.
A dynamic support and resistance indicator that predicts zones based on market trend, providing real-time insights into potential price reversal and continuation points.
A trend channel indicator that identifies support and resistance zones using pivot highs and lows, helping traders visualize market trends and potential breakout points.
SwingArms is a color-coded trend indicator that visually confirms market trend changes using green and red signals for bullish and bearish movements respectively.
Likes, views, and comments are historical TradingView snapshots. They describe attention, not trading performance.