Linear Regression Oscillator [ChartPrime]
A custom indicator using linear regression to analyze closing prices, helping traders identify market trends, mean reversion, and potential overbought or oversold conditions across different timeframes.
Explore 11,183 indicators. Filter beyond the obvious.
Discover the tools that fit the way you trade.
11,183 tools to explore
A custom indicator using linear regression to analyze closing prices, helping traders identify market trends, mean reversion, and potential overbought or oversold conditions across different timeframes.
A customizable moving average indicator that combines trend analysis with mean reversion detection, offering dynamic candle coloring and an oscillator to identify potential price shifts.
Fair value bands assess price behavior by tracking deviations from a mean basis, helping traders identify normal and abnormal price movements through dynamic statistical bands.
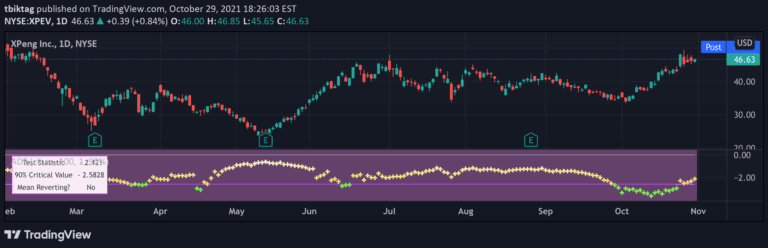
The Augmented Dickey-Fuller test statistically evaluates mean reversion in price series by analyzing the tendency of prices to return to an average level over time.
The Aroon Oscillator with Mean Reversion is a versatile trading tool that tracks trend strength and potential reversals by measuring price momentum and identifying potential trend changes.
A sophisticated indicator using Chebyshev filter technology to detect price divergences and potential mean reversion points by comparing price against a filtered price series.
A quantitative price forecasting indicator that analyzes past price data to predict future movements, calculate probabilities, and highlight potential trading opportunities using mean-reverting logic.
A technical indicator that measures market volatility and momentum to help traders identify optimal trading periods and filter out false signals across different market conditions.
Dynamic grid trading indicator that uses parabolic curves to create adaptive support and resistance levels across different market conditions and trends.
A complex trading indicator combining Mandelbrot's fractal theory and Fibonacci sequences to analyze market dynamics, revealing hidden mathematical patterns in price movements.
A sophisticated Bayesian probability indicator that transforms complex market analysis into actionable trading signals by dynamically evaluating price trends across multiple timeframes.
An adaptive technical indicator that combines price analysis and volatility measurement to identify market trends, reversals, and volatility conditions with dynamic zone adjustments.
Likes, views, and comments are historical TradingView snapshots. They describe attention, not trading performance.