Linear Regression Oscillator [ChartPrime]
A custom indicator using linear regression to analyze closing prices, helping traders identify market trends, mean reversion, and potential overbought or oversold conditions across different timeframes.
Explore 11,183 indicators. Filter beyond the obvious.
Discover the tools that fit the way you trade.
11,183 tools to explore
A custom indicator using linear regression to analyze closing prices, helping traders identify market trends, mean reversion, and potential overbought or oversold conditions across different timeframes.
A customizable moving average indicator that combines trend analysis with mean reversion detection, offering dynamic candle coloring and an oscillator to identify potential price shifts.
A trading screener that identifies potential overbought or oversold market conditions across multiple symbols using a Mean Reversion Channel. Helps traders quickly scan assets for trading opportunities.
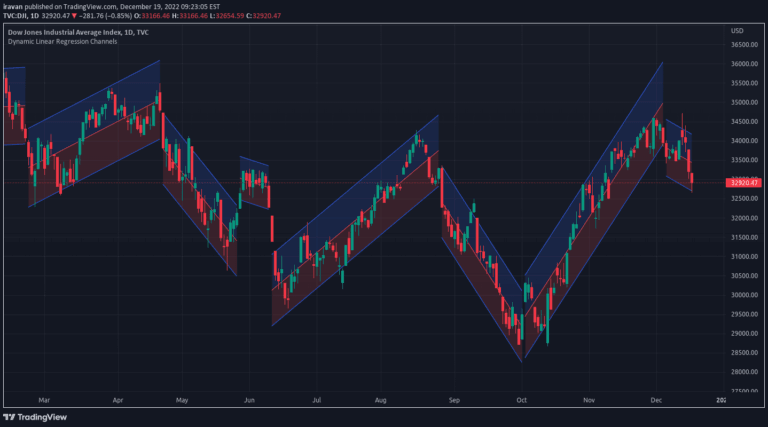
A dynamic linear regression channel indicator that adapts to price movements by creating new channels when previous channels break, helping traders identify trend changes and key price levels.
Market Structure Trend Targets tracks trend direction by identifying breakout points, dynamic stop losses, and potential mean reversion signals for strategic trading decisions.
A pivot-based liquidity indicator that identifies and tracks significant price levels with expanding channels, helping traders visualize potential order zones and liquidity areas.
The Standardized SuperTrend Oscillator transforms the SuperTrend indicator into a dynamic tool for analyzing market trends, offering insights into potential reversals and mean reversion opportunities.
A volume profile indicator that creates an angled linear regression channel to analyze trading activity and volume distribution across price ranges during a specific time interval.
A technical indicator using zero-lag EMA and dynamic trend analysis to track market momentum, providing adaptive signals for trend identification and potential reversals.
A dynamic Fibonacci-based indicator that identifies support, resistance, and trend zones using multiple ratio bands to highlight potential price reversal and liquidity sweep points.
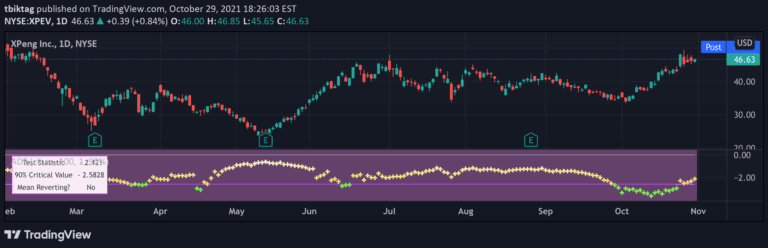
The Augmented Dickey-Fuller test statistically evaluates mean reversion in price series by analyzing the tendency of prices to return to an average level over time.
A dynamic cloud trend indicator that combines trend following and mean reversion, visualizing market conditions through adaptive high and low bands with color-coded insights.
Likes, views, and comments are historical TradingView snapshots. They describe attention, not trading performance.