Trend Channels With Liquidity Breaks [ChartPrime]
A trend channel indicator that identifies support and resistance zones using pivot highs and lows, helping traders visualize market trends and potential breakout points.
Explore 11,183 indicators. Filter beyond the obvious.
Discover the tools that fit the way you trade.
11,183 tools to explore
A trend channel indicator that identifies support and resistance zones using pivot highs and lows, helping traders visualize market trends and potential breakout points.
A multi-timeframe Fair Value Gap indicator that identifies market imbalances and potential price targets by highlighting gaps between price candles across different timeframes.
The Relative Trend Index (RTI) is an advanced technical indicator that measures trend strength by analyzing price positioning within its recent range, offering more adaptive insights than traditional momentum tools.
A trend reversal probability indicator that uses custom oscillator calculations to estimate market direction shifts and potential trend changes with statistical probability analysis.
A trading tool that plots global market sessions with volume and delta analytics, helping traders visualize institutional activity and key market structure zones.
A higher timeframe trend mapping tool that visually overlays market structure, trend direction, and price boundaries onto intraday charts for enhanced trading context.
An indicator that captures price gaps between trading sessions, displaying the opening range with midpoint and quartile lines to help traders understand market transitions.
A trading indicator that analyzes the relationship between current and previous price candles, providing insights into potential market direction and momentum through price action analysis.
An advanced Fibonacci retracement script offering dual lookback periods for comprehensive market analysis, providing dynamic and customizable support and resistance levels across different timeframes.
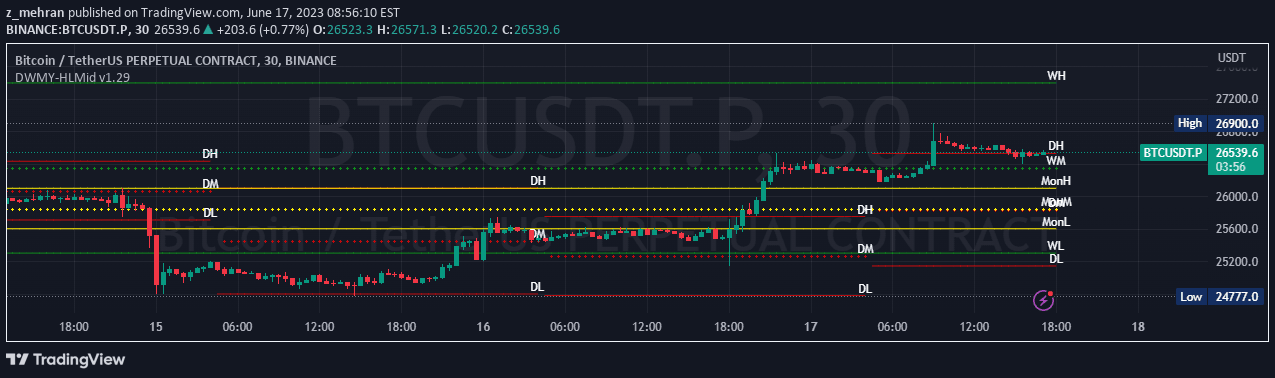
A comprehensive price level indicator that tracks daily, weekly, monthly, quarterly, and yearly high, mid, and low values to help traders analyze market movements and identify key support and resistance levels.
A sophisticated indicator that identifies Fair Value Gaps using volume analysis, revealing market inefficiencies and potential price targets with volume-filtered structural insights.
A dynamic RSI variant that adapts its calculation length based on market volatility and momentum, providing more responsive and context-aware trading signals.
Likes, views, and comments are historical TradingView snapshots. They describe attention, not trading performance.