YOUR INDICATOR RESEARCH STARTS HERE

Find the right indicator.
Understand what it does.

Explore 11,183 indicators. Filter beyond the obvious.
Discover the tools that fit the way you trade.

THE INDICATOR LIBRARY

Results for “money_flow”

11,183 tools to explore

111 indicators matching your filters
Save search
LevelsSignalVolume

Money Flow Profile [LuxAlgo]

by LuxAlgo

A charting tool that measures traded volume and money flow across price levels, revealing trading activity, sentiment, and key market levels for strategic analysis.

Main price chart · unverifiedScalping · Day Trading
Explore
9.6Klikes216.8Kviews43comments
Save
MomentumOscillatorTrend

RMI Trend Sniper

by TZack88

The RMI Trend Sniper is a sophisticated trend-following indicator that combines RSI and MFI to generate momentum signals and identify potential market trend reversals.

Separate pane · unverifiedScalping · Day Trading
Explore
7.3Klikes149.8Kviews127comments
Save
MomentumSignalTrend

AlphaTrend - Screener

by KivancOzbilgic

AlphaTrend is a dynamic trend-following indicator that uses Money Flow Index or RSI to generate buy and sell signals based on trend direction and momentum crossovers.

Main price chart · unverifiedScalping · Day Trading
Explore
7.2Klikes134Kviews64comments
Save
LevelsSignalVolume

Delta Flow Profile [LuxAlgo]

by LuxAlgo

A charting tool that tracks money flow and trading pressure across different price ranges, revealing market sentiment and significant price levels through buying and selling activity visualization.

Main price chart · unverifiedScalping · Day Trading
Explore
5.3Klikes78.1Kviews22comments
Save
VolumeMomentumEditor’s pick

Indicators Overlay

by LonesomeTheBlue

A comprehensive multi-indicator script that displays various technical indicators in separate windows, allowing traders to customize and analyze market momentum, volume, and trend signals.

Separate pane · unverifiedDay Trading · Swing Trading
Explore
4.6Klikes83.3Kviews144comments
Save
VolumeTrendEditor’s pick

Open Interest Chart [LuxAlgo]

by LuxAlgo

Open Interest Chart visualizes futures market activity using a circular plot that tracks percentage changes in open interest, indicating money flow and market liquidity.

Separate pane · unverifiedDay Trading · Swing Trading
Explore
2.4Klikes119Kviews23comments
Save
VolumeTrendEditor’s pick

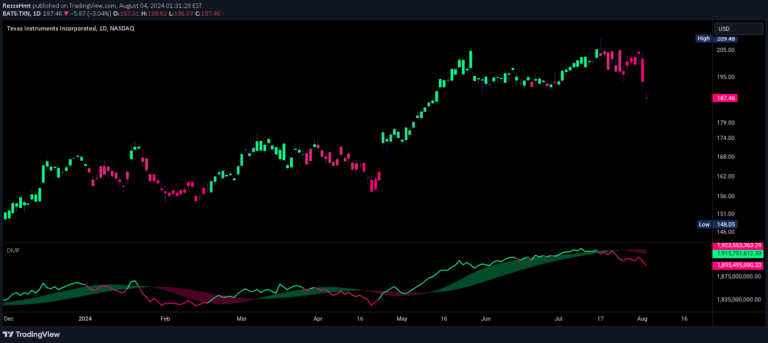
Dynamic Money Flow

by RezzaHmt

Dynamic Money Flow is an advanced volume indicator that enhances traditional money flow analysis by incorporating true range and close price movements to provide more accurate trend and volume insights.

Separate pane · unverifiedDay Trading · Swing Trading
Explore
1.9Klikes56.6Kviews44comments
Save
MomentumOscillatorVolume

Asset Rotation Aperture

by ColeGarner

Asset Rotation Aperture tracks volume accumulation across multiple assets, visualizing capital rotation and market narratives through normalized cumulative volume lines.

Separate pane · unverifiedScalping · Day Trading
Explore
1.5Klikes19.1Kviews30comments
Save

Likes, views, and comments are historical TradingView snapshots. They describe attention, not trading performance.

START WITH A QUESTION

A little less searching.
A lot more understanding.

Tell DeepAlpha what you need. Get an explanation, a shortlist,
and a direct path to the indicators behind it.

Ask DeepAlpha