CM MACD Custom Indicator - Multiple Time Frame - V2
CM MACD Ultimate Multi-Timeframe V2 is an advanced MACD indicator with enhanced customization options, multi-timeframe analysis, and comprehensive trend visualization features.
Explore 11,183 indicators. Filter beyond the obvious.
Discover the tools that fit the way you trade.
11,183 tools to explore
CM MACD Ultimate Multi-Timeframe V2 is an advanced MACD indicator with enhanced customization options, multi-timeframe analysis, and comprehensive trend visualization features.
A festive TradingView indicator that adds playful snowflake labels to the chart, designed to bring holiday cheer while exploring chart visualization capabilities.
An advanced EMA visualization tool that reveals market mood and trend dynamics through color-coded EMA lines, helping traders understand chart movements more intuitively.
EMA crossover indicator that identifies market mood by tracking short-term and long-term exponential moving averages and generating buy/sell signals based on their intersections.
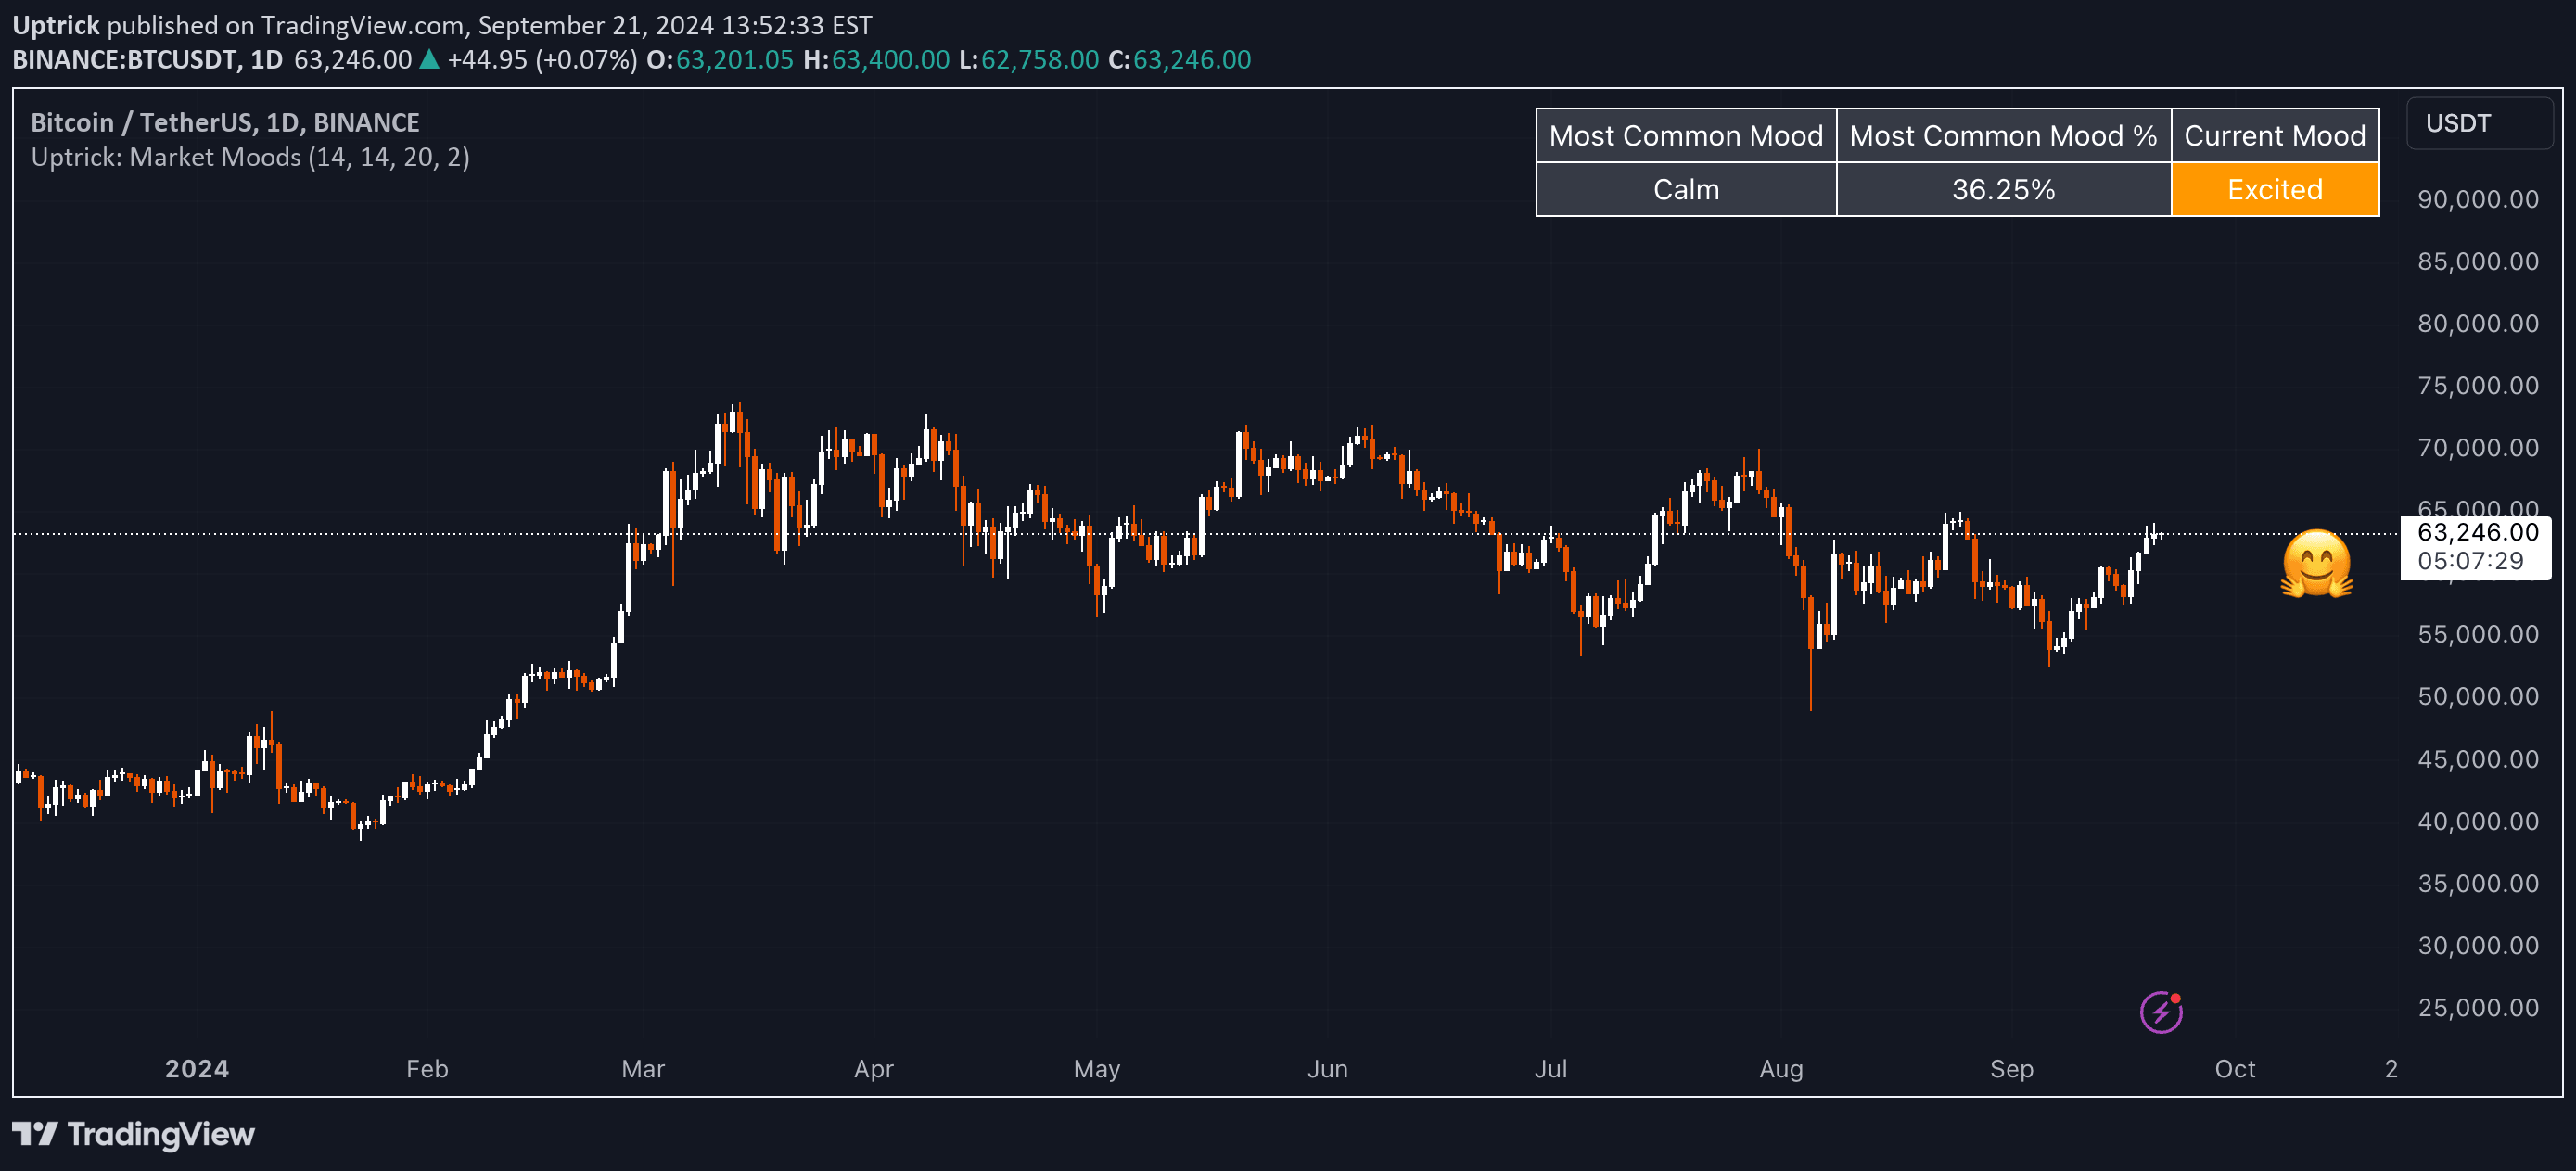
A multi-dimensional market sentiment indicator combining RSI, ATR, and Bollinger Bands to analyze market mood and provide comprehensive insights into price dynamics and emotional market states.
A festive trading visualization script that generates a 3D Christmas tree with decorations on the chart, offering a unique and customizable graphical representation of market data.
A sentiment indicator using RSI to map market mood directly on the price chart, providing visual insights into bullish, neutral, and bearish conditions.
A sophisticated market sentiment tool that translates complex financial signals into an intuitive oscillator, revealing potential market mood and directional insights across various tradable assets.
A festive trading chart visualization with holiday-themed snowflakes and candlesticks, designed to enhance the visual trading experience with seasonal cheer.
Likes, views, and comments are historical TradingView snapshots. They describe attention, not trading performance.