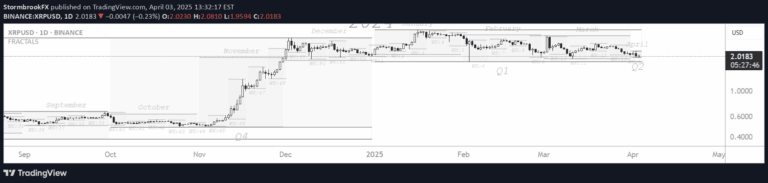
Fibonacci 3-D
A multi-dimensional Fibonacci tool that uses three points to create advanced projections, offering dynamic support and resistance analysis beyond traditional methods.
Explore 11,183 indicators. Filter beyond the obvious.
Discover the tools that fit the way you trade.
11,183 tools to explore
A multi-dimensional Fibonacci tool that uses three points to create advanced projections, offering dynamic support and resistance analysis beyond traditional methods.
An advanced astrological indicator tracking celestial body longitudes to provide unique insights into market movements and potential trading signals using astronomical positioning.
DataChart is a flexible library for creating visual data representations like scatterplots and heatmaps, enabling traders to plot and analyze sample data with customizable chart properties.
A unique indicator that uses fractal dimension and multidimensional momentum to identify market consolidation periods, helping traders detect potential reversal or breakout zones.
Fractal Dimensions is a multi-timeframe analysis tool that visualizes market dynamics across different wave degrees, providing deeper insights into market structure and potential trading opportunities.
Advanced predictive algorithm using Fourier analysis to decompose historical price data and identify complex market patterns across multiple dimensions for enhanced forecasting.
Likes, views, and comments are historical TradingView snapshots. They describe attention, not trading performance.