Market Sessions - By Leviathan
A customizable market session tracker displaying trading hours for Tokyo, London, New York, and Sydney with multiple visualization options and advanced trading insights.
Explore 11,183 indicators. Filter beyond the obvious.
Discover the tools that fit the way you trade.
11,183 tools to explore
A customizable market session tracker displaying trading hours for Tokyo, London, New York, and Sydney with multiple visualization options and advanced trading insights.
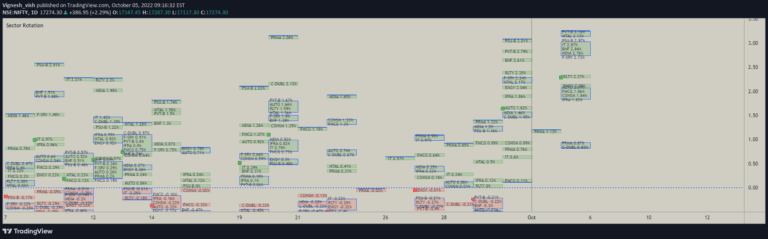
A comprehensive trading tool for visualizing and tracking performance across major Indian market sectors, allowing real-time and historical sector analysis with customizable visualization options.
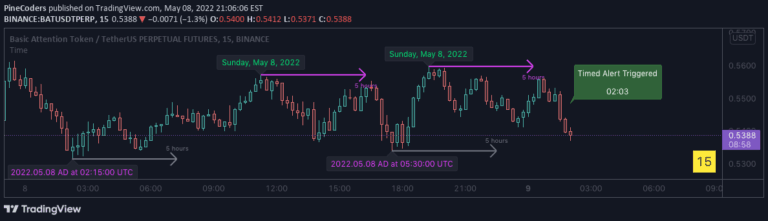
A powerful trading tool that visualizes multiple market sessions with customizable session panels, highlighting price action, volatility, and session-specific details directly on the chart.
A dynamic ticker tape that displays real-time price updates and daily changes for multiple securities, scrolling horizontally across the chart bottom for instant market insights.
Bitcoin ETF Tracker provides comprehensive real-time data on Bitcoin ETFs, offering traders a centralized tool to monitor key performance metrics and trading information.
A Pine Script library offering advanced time manipulation functions to format timestamps, calculate time offsets, and convert time units for precise trading analysis and visualization.
A comprehensive Pinescript library for managing label and line object arrays, offering flexible creation, manipulation, and customization of graphical annotations on trading charts.
A unique calendar indicator that displays the Mayan Long Count, Tzolk'in, and Haab' dates based on real-time UTC time, offering a symbolic approach to tracking financial timeframes.
A specialized indicator tracking US presidential election and inauguration dates, designed to help traders visualize historical political events and potential market correlations.
A market structure indicator tracking swing-low breakdowns and swing-high breakups, helping traders identify trend shifts and momentum changes in stock markets.
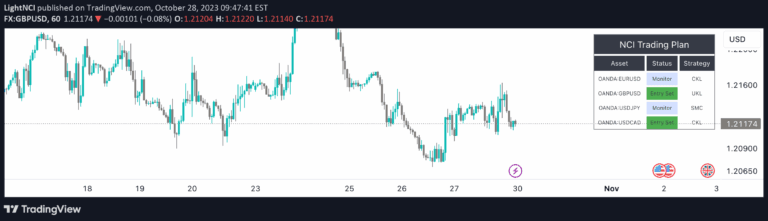
NCI Trading Plan is a comprehensive multi-asset trading management tool that helps traders track and organize trading statuses, strategies, and potential opportunities across different financial instruments.
A comprehensive inflation tracking tool displaying year-over-year inflation rates for multiple countries, providing a quick visual overview of global economic trends.
Likes, views, and comments are historical TradingView snapshots. They describe attention, not trading performance.