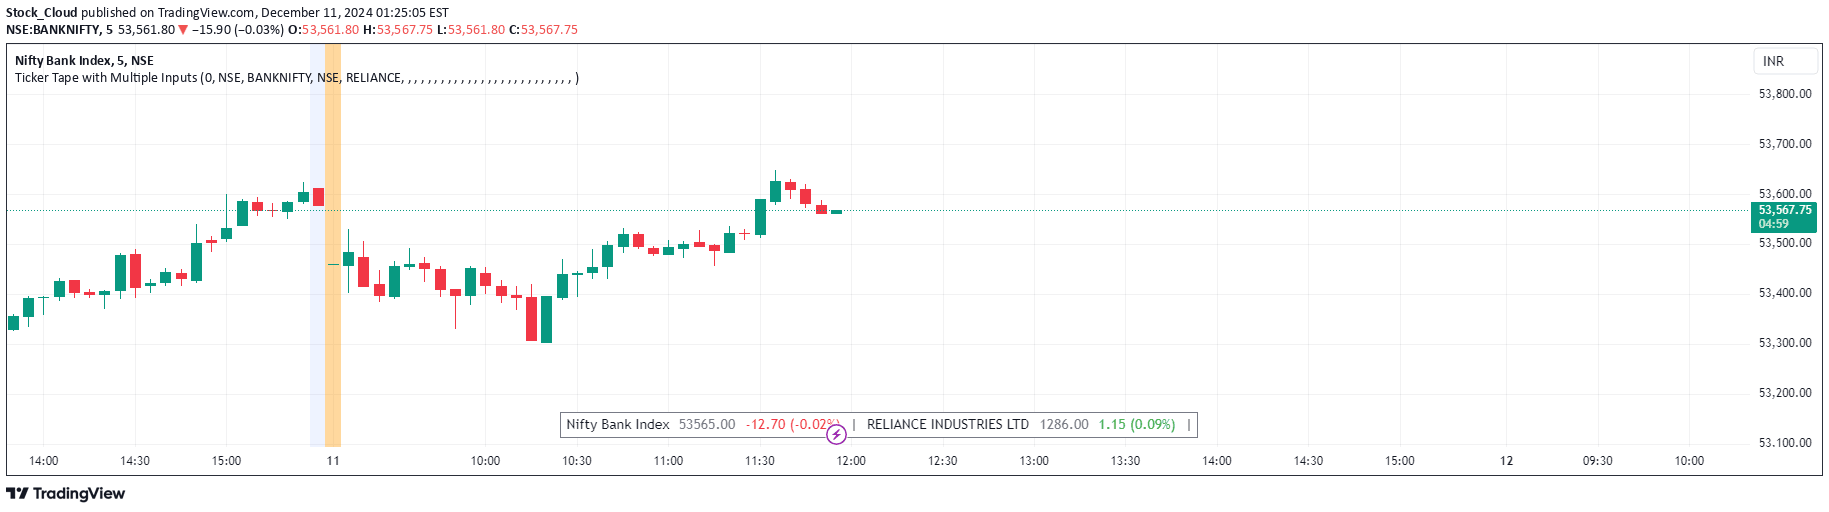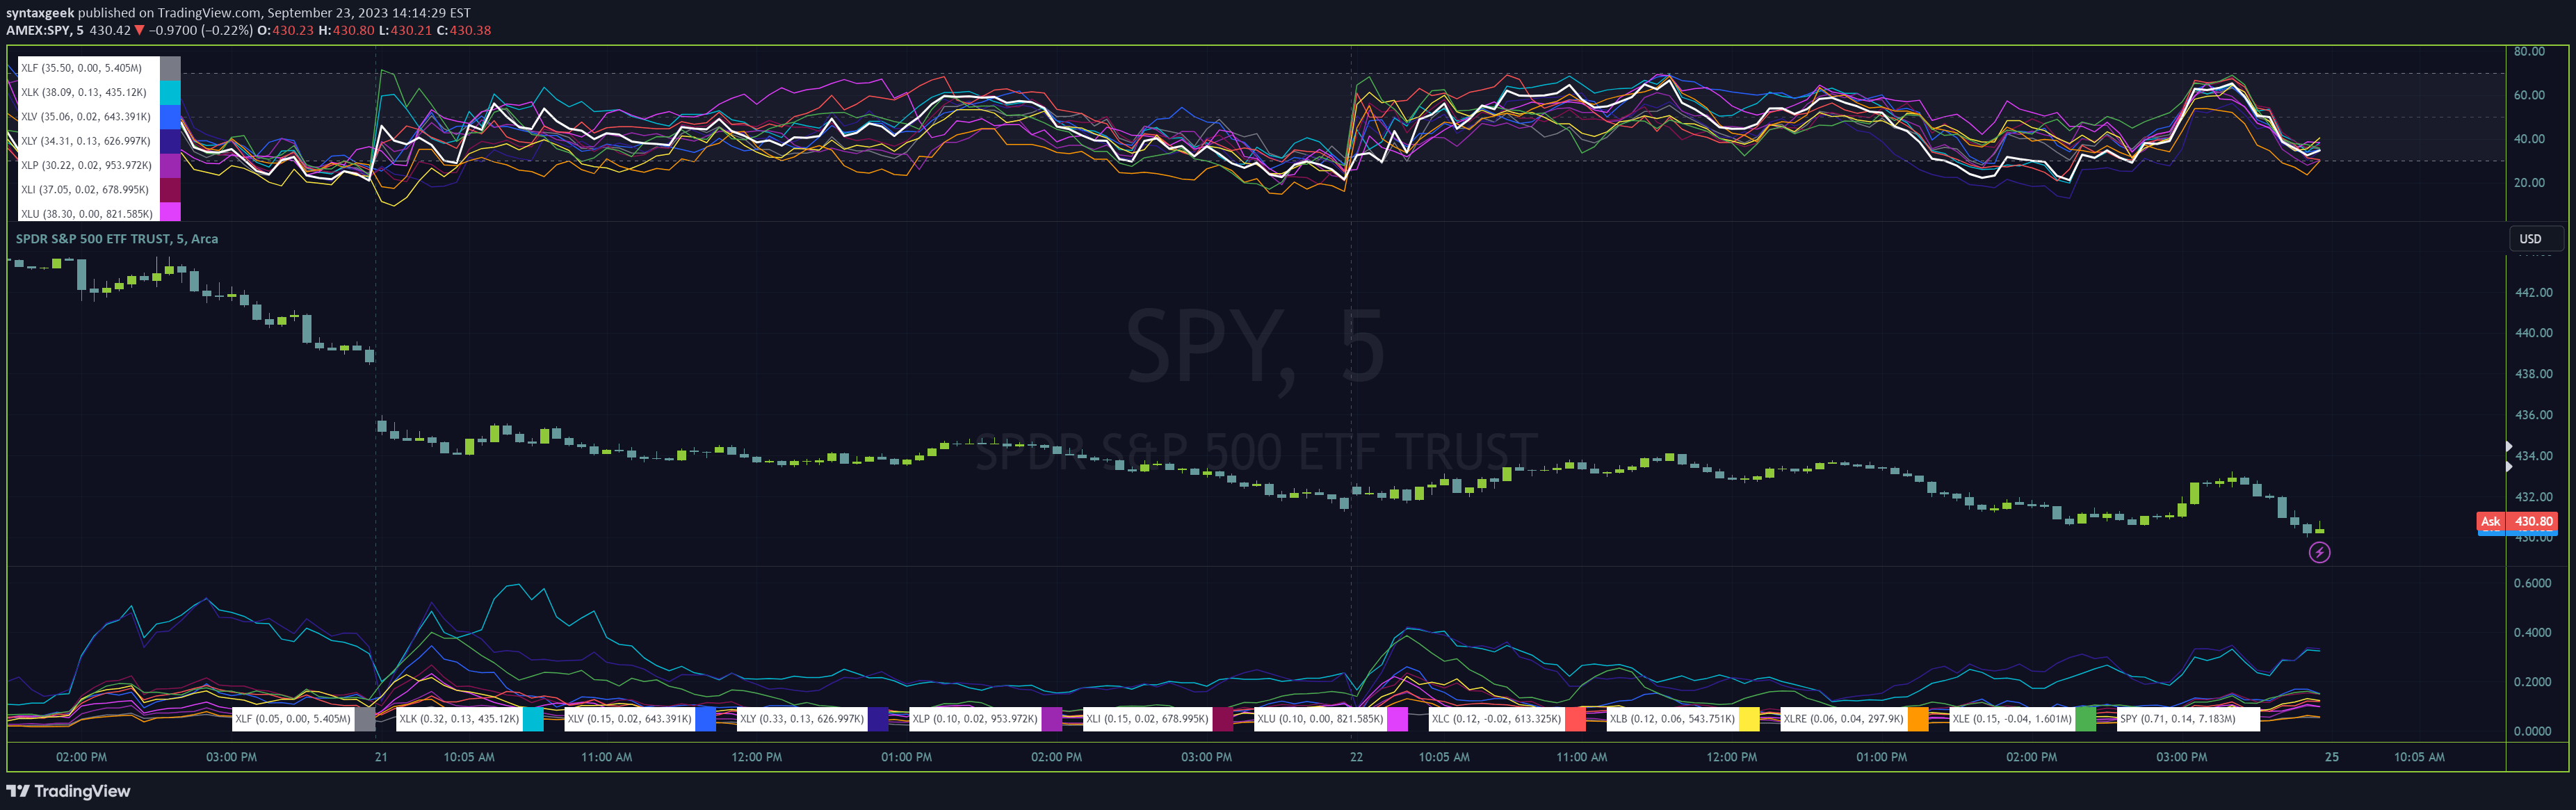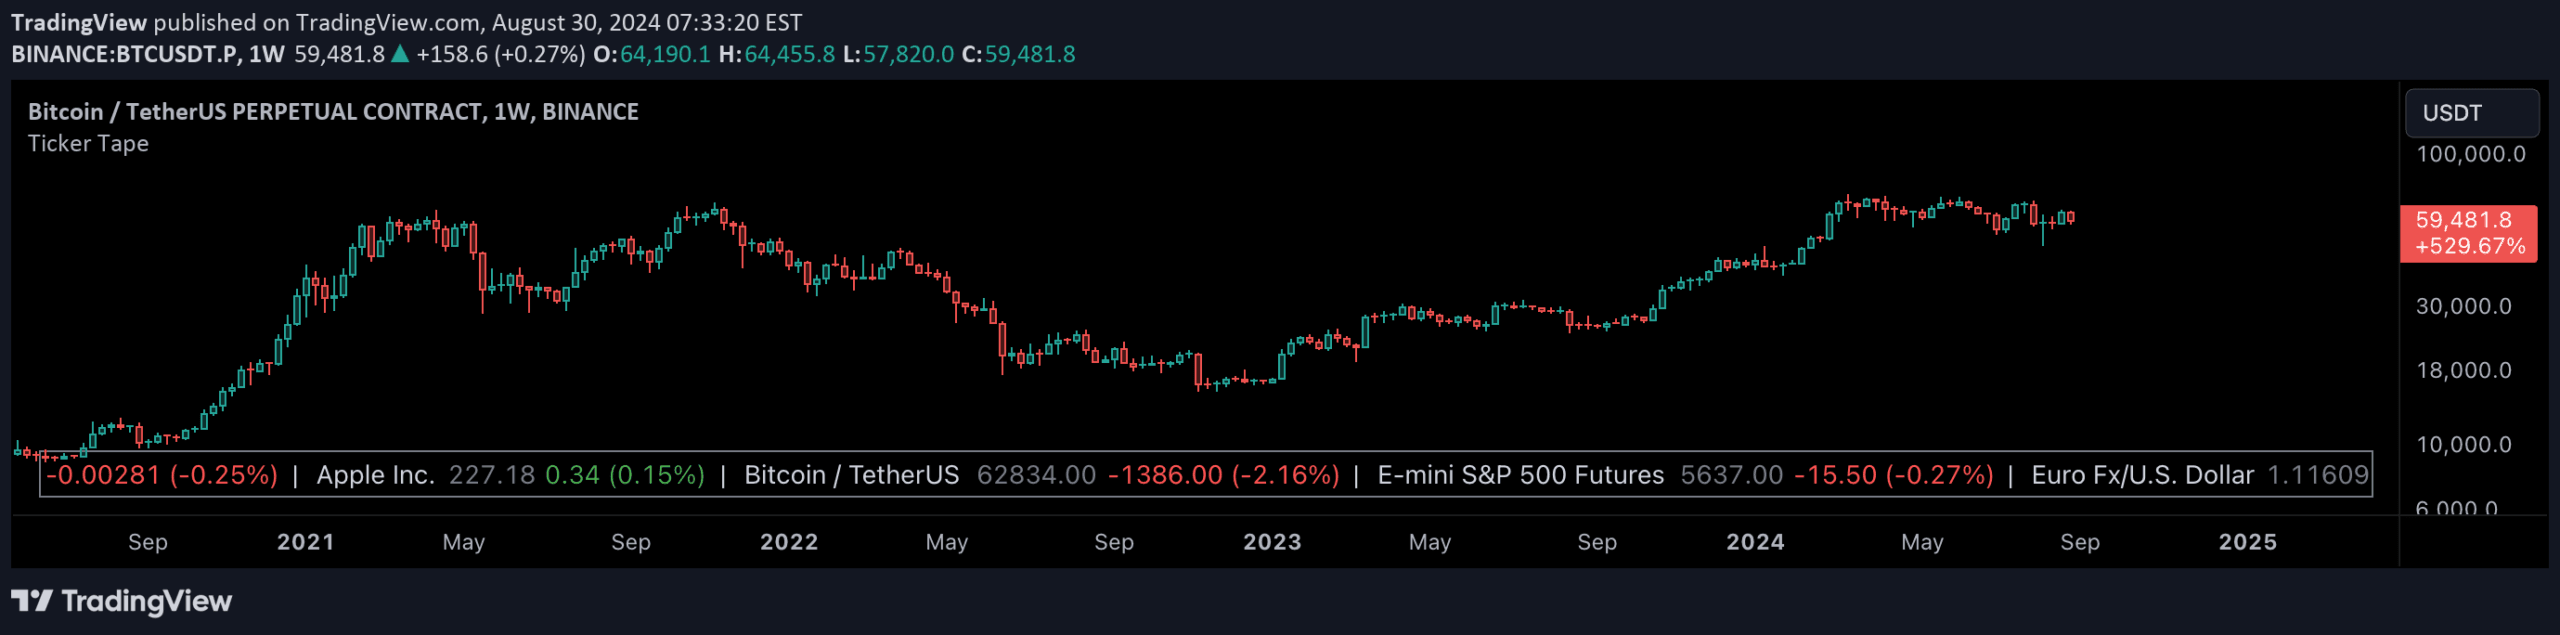
A dynamic ticker tape that displays real-time price updates and daily changes for multiple securities, scrolling horizontally across the chart bottom for instant market insights.
Explore complementary indicator rolesHow it works
The ticker tape indicator creates a scrolling display by dynamically requesting price and market information for a user-specified list of up to 40 securities. Users input symbol names separated by commas, which can include exchange prefixes for precise data retrieval. The script uses dynamic requests to fetch real-time market data, including current prices, daily price changes, and percentage variations.
As new chart ticks become available, the indicator updates the displayed information, with price changes color-coded to show directional movements. The tape scrolls horizontally from right to left, creating a continuous stream of market information that updates incrementally based on the frequency of chart updates.
Why it may be useful
This indicator provides traders with an instant, comprehensive view of multiple market securities simultaneously, transforming complex market data into an easily digestible format. By displaying real-time price changes and movements across different securities, traders can quickly monitor market trends, identify potential opportunities, and stay informed about various financial instruments without switching between multiple charts or platforms.
The color-coded display enables rapid visual interpretation of market dynamics, with green indicating positive changes, red showing negative movements, and gray representing neutral conditions. This real-time visualization allows traders to make more informed decisions by providing an immediate snapshot of market sentiment and price trends across multiple securities.
When to explore it
The ticker tape is most effective for active traders who need to monitor multiple securities simultaneously, particularly during high-volatility market periods. It is especially useful for traders tracking cross-market relationships, comparing performance across different exchanges, or keeping an eye on multiple assets within a specific sector or investment strategy.
Day traders and scalpers will find this tool particularly valuable, as it provides instant updates and allows quick assessment of market movements. The indicator works best with frequently updated chart data and is ideal for traders who require rapid, comprehensive market information without disrupting their primary trading analysis.
Keep exploring
What we’ve verified
Access, alerts and repainting behaviour have not been independently verified for this indicator. Check the creator’s current publication and settings.
General descriptions and classifications are recovered research. Verified details above identify the specific checks we have completed. Check the creator’s current publication for later changes.