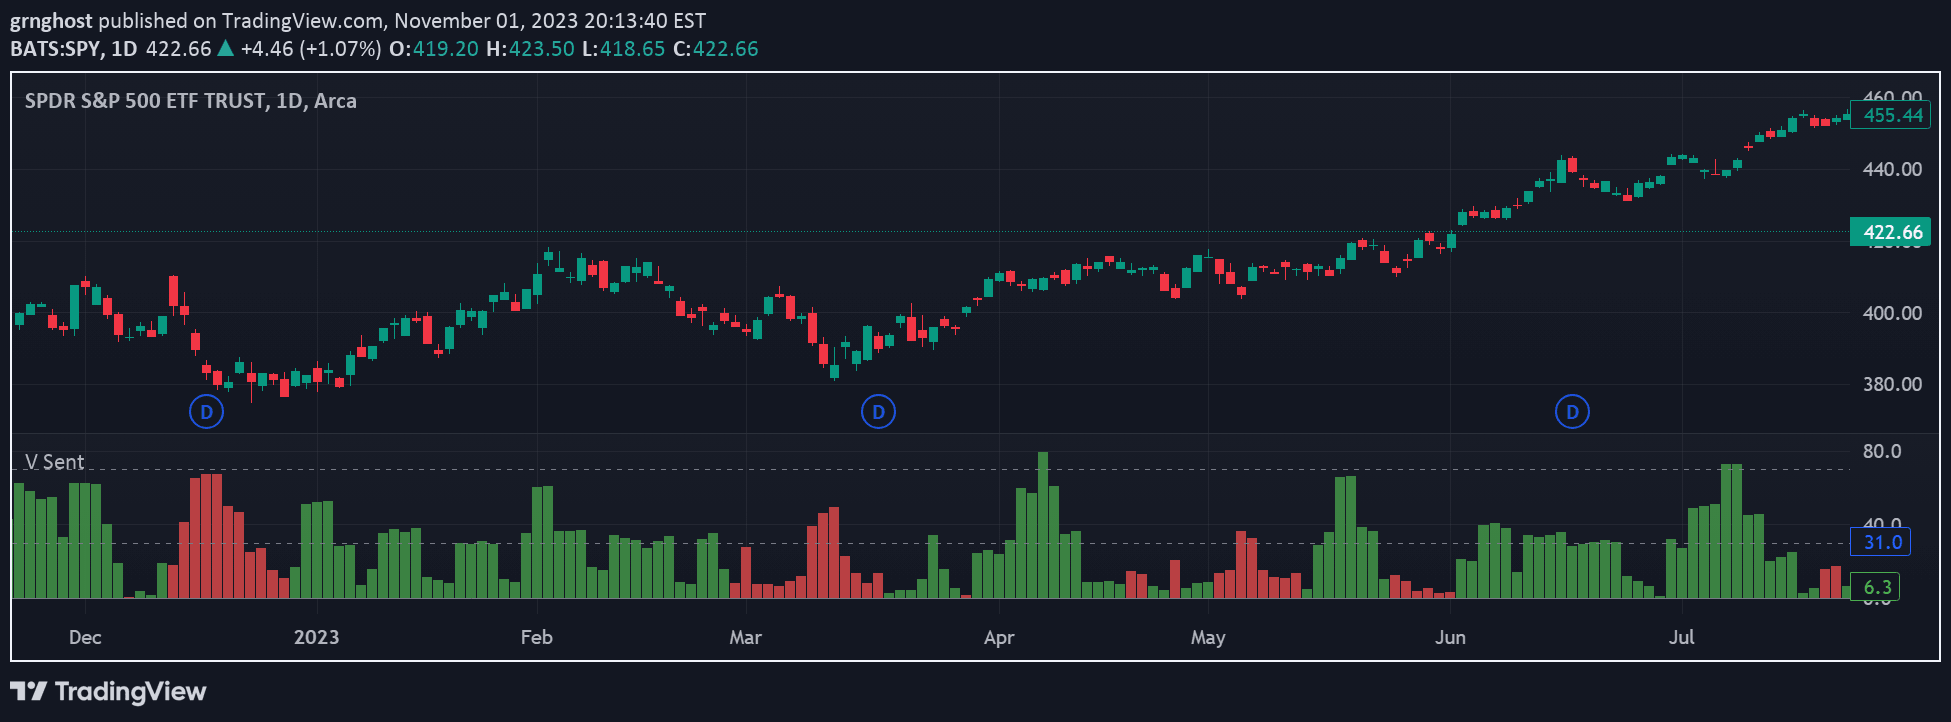
A stablecoin dominance indicator tracking USDT and USDC market share across timeframes, revealing liquidity shifts and investor sentiment through combined candlestick representation.
Explore complementary indicator rolesHow it works
The stablecoin dominance indicator combines the market share percentages of USDT and USDC, creating a comprehensive view of total stablecoin liquidity in the cryptocurrency market. By aggregating these two major stablecoins, the indicator generates candlestick charts that visually represent the combined dominance across different timeframes.
Green candles indicate an increase in stablecoin market share, suggesting investors are moving funds into stable assets. Red candles represent a decline in stablecoin dominance, potentially signaling increased risk appetite and movement into more volatile cryptocurrencies.
Why it may be useful
Stablecoin dominance provides critical insights into market sentiment and potential trend reversals by tracking liquidity flow between stable and volatile assets. Traders can use this indicator to understand broader market psychology, gauging whether investors are becoming more risk-averse or risk-seeking based on stablecoin allocation.
The indicator helps traders make more informed decisions by offering a macro perspective on market dynamics. By monitoring shifts in stablecoin dominance, investors can anticipate potential market movements and adjust their trading strategies accordingly.
When to explore it
The stablecoin dominance indicator is most effective during periods of market uncertainty or potential trend transitions. Traders can utilize this tool to identify potential trend reversals, especially when stablecoin dominance shows significant changes that might precede broader market movements.
It is particularly useful during volatile market conditions, such as before major economic announcements, cryptocurrency regulatory news, or significant global events that could impact investor sentiment. Traders across different timeframes, from scalpers to swing traders, can leverage this indicator to gain insights into market liquidity and potential directional shifts.
Keep exploring
What we’ve verified
Access, alerts and repainting behaviour have not been independently verified for this indicator. Check the creator’s current publication and settings.
General descriptions and classifications are recovered research. Verified details above identify the specific checks we have completed. Check the creator’s current publication for later changes.