YOUR INDICATOR RESEARCH STARTS HERE

Find the right indicator.
Understand what it does.

Explore 11,183 indicators. Filter beyond the obvious.
Discover the tools that fit the way you trade.

THE INDICATOR LIBRARY

Results for “number”

11,183 tools to explore

834 indicators matching your filters
Save search
TrendEditor’s pick

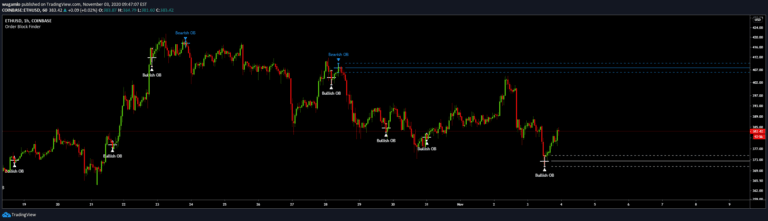
Order Block Finder (Experimental)

by wugamlo

An indicator identifying institutional order blocks by detecting significant price zones where potential trend reversals or continuations might occur based on sequential candle patterns.

Main price chart · unverifiedSwing Trading
Explore
22.1Klikes841.2Kviews406comments

Save
VolumeEditor’s pick

Volume Profile / Fixed Range

by LonesomeTheBlue

A Volume Profile indicator that calculates trading volumes within a fixed range, helping traders understand volume distribution and identifying key price levels with visual representation.

Main price chart · unverifiedDay Trading · Swing Trading
Explore
13.4Klikes576.6Kviews171comments
Save
LevelsSignalTrend

DTFX Algo Zones [LuxAlgo]

by LuxAlgo

Auto-generated Fibonacci Retracements that identify market structure shifts and potential support/resistance zones based on technical breaks and price action dynamics.

Main price chart · unverifiedScalping · Day Trading
Explore
9.4Klikes142Kviews67comments
Save
TrendMomentum

FluidTrades - SMC Lite

by Pmgjiv

A trading indicator that uses pivot points to identify supply and demand zones, market structure, and potential trading opportunities through visual analysis of price action.

Main price chart · unverifiedSwing Trading
Explore
9.4Klikes317.3Kviews171comments
Save
TrendEditor’s pick

Cup Finder

by LonesomeTheBlue

A technical analysis script that identifies cup-like price formations by creating channels and tracking potential breakout points in financial markets using specific bar search and channel width parameters.

Main price chart · unverifiedSwing Trading
Explore
9.1Klikes127Kviews90comments
Save
LevelsSignalVolume

Liquidity Pools [LuxAlgo]

by LuxAlgo

A dynamic indicator that identifies potential liquidity pools by tracking price interactions with specific zones, helping traders anticipate market movements and institutional trading strategies.

Main price chart · unverifiedScalping · Day Trading
Explore
8.8Klikes139.2Kviews8comments
Save
VolumeEditor’s pick

Tick Chart

by LonesomeTheBlue

Tick Chart is a unique charting method that creates candlesticks based on a specific number of price ticks, offering an alternative to time-based charts for analyzing market movements.

Main price chart · unverifiedScalping · Day Trading
Explore
7.5Klikes149.3Kviews105comments
Save
LevelsSignal

Swing Levels and Liquidity - By Leviathan

by LeviathanCapital

An advanced script that identifies and visualizes pivot points, helping traders recognize market structure, potential support/resistance levels, and trading opportunities through customizable swing high and low indicators.

Main price chart · unverifiedScalping · Day Trading
Explore
7.3Klikes202.2Kviews118comments
Save
LevelsSignalTrend

Protected Highs & Lows [TFO]

by tradeforopp

A market structure indicator that identifies trend reversals and continuations by tracking protected highs and lows, helping traders recognize significant price movement shifts.

Main price chart · unverifiedScalping · Day Trading
Explore
6Klikes110.1Kviews70comments
Save
LevelsSignalTrend

Fibonacci Ranges (Real-Time) [LuxAlgo]

by LuxAlgo

A Fibonacci-based indicator that creates dynamic trading channels and levels using swing highs and lows, helping traders identify potential support, resistance, and trend reversal points.

Main price chart · unverifiedScalping · Day Trading
Explore
5.9Klikes176.1Kviews25comments
Save

Likes, views, and comments are historical TradingView snapshots. They describe attention, not trading performance.

START WITH A QUESTION

A little less searching.
A lot more understanding.

Tell DeepAlpha what you need. Get an explanation, a shortlist,
and a direct path to the indicators behind it.

Ask DeepAlpha