Support Resistance MTF
A multi-timeframe support and resistance indicator that helps traders identify key price levels by analyzing market data across different time frames and customizable settings.
Explore 11,183 indicators. Filter beyond the obvious.
Discover the tools that fit the way you trade.
11,183 tools to explore
A multi-timeframe support and resistance indicator that helps traders identify key price levels by analyzing market data across different time frames and customizable settings.
Fibonacci Time-Price Zones is an advanced indicator that combines Fibonacci ratios with time and price analysis, offering multiple geometric visualization methods to identify market turning points.
A multi-timeframe Fair Value Gap (FVG) indicator that identifies potential price reaction zones by analyzing overlapping price gaps across different chart periods.
A pivot-based liquidity indicator that identifies and tracks significant price levels with expanding channels, helping traders visualize potential order zones and liquidity areas.
A trading strategy focusing on identifying potential price continuation after 11:30 AM EST, using high/low of day zones and momentum indicators to signal trading opportunities.
A timing-based indicator that displays key market session ranges, including Asia, London, and New York sessions, with customizable boxes and price level references for intraday trading analysis.
A Monte Carlo simulation tool that generates potential future price paths by randomly shuffling historical price changes to predict potential market movements and support/resistance levels.
A flexible Fibonacci-based indicator that allows traders to customize order block regions, pivot point precision, and zone selection with multiple configuration options.
The Anchored Monte Carlo Shuffled Projection tool simulates potential future price points by randomly shuffling historical bar movements from a user-defined anchor point.
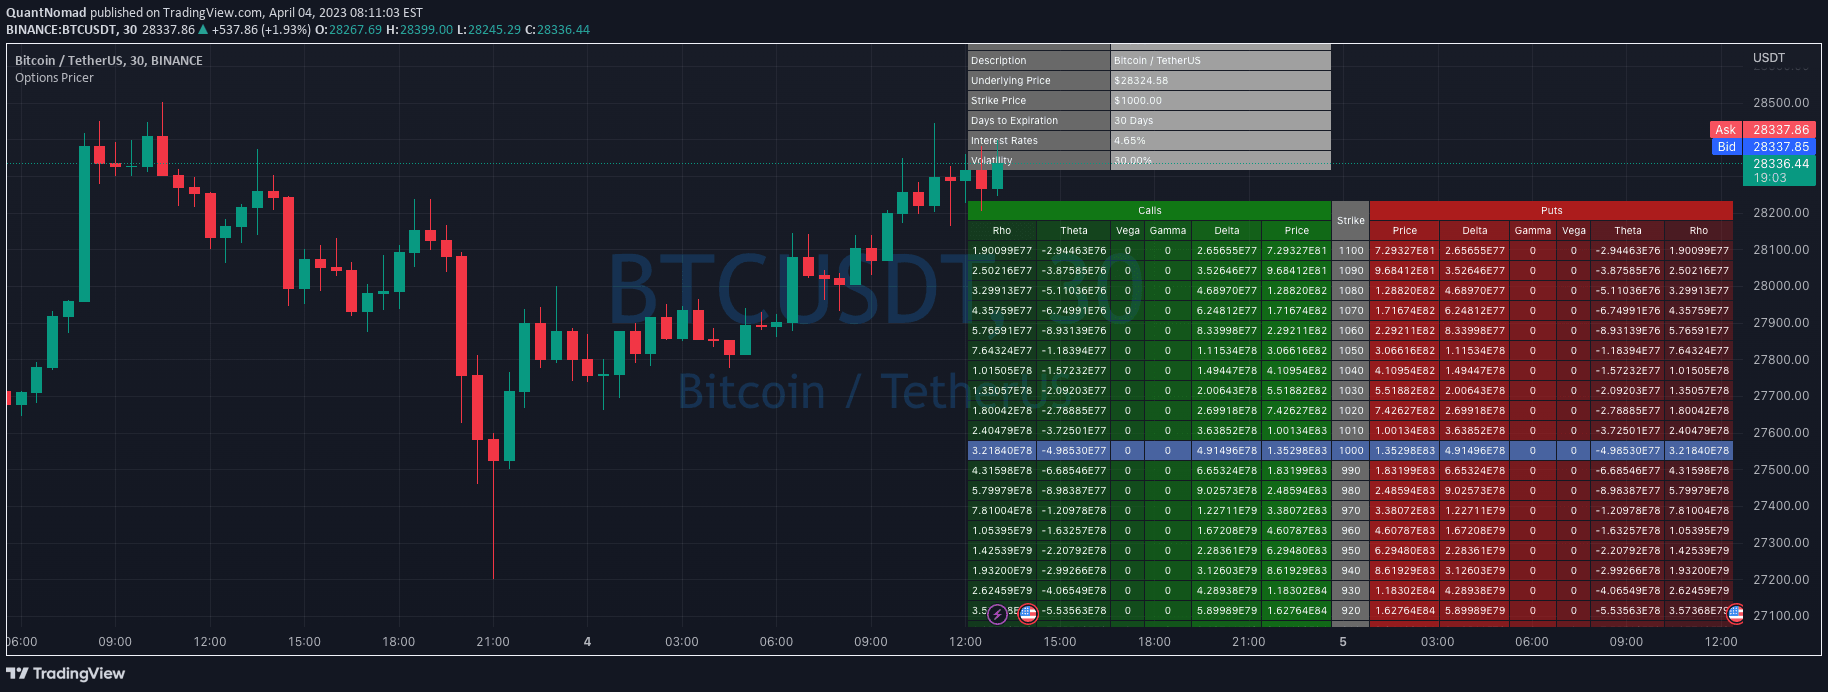
A TradingView option pricing tool that computes option prices and greeks for both put and call options using strikes, implied volatility, and days to expiry.
A comprehensive TradingView indicator for Bank Nifty index analysis using multiple technical indicators and advanced moving average techniques to generate trading signals.
A comprehensive options pricing and risk analysis tool using the Black-Scholes model, providing theoretical option prices, Greeks, and implied volatility for accurate options trading insights.
Likes, views, and comments are historical TradingView snapshots. They describe attention, not trading performance.