Support and Resistance Signals MTF [LuxAlgo]
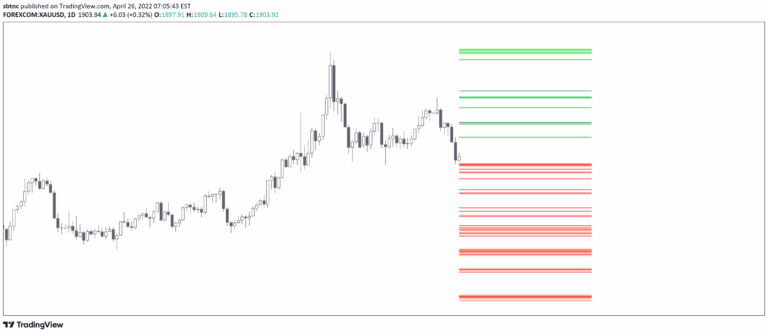
A multi-timeframe support and resistance indicator that identifies key price levels, breakouts, tests, retests, and rejections to help traders understand market dynamics.
Explore 11,183 indicators. Filter beyond the obvious.
Discover the tools that fit the way you trade.
11,183 tools to explore
A multi-timeframe support and resistance indicator that identifies key price levels, breakouts, tests, retests, and rejections to help traders understand market dynamics.
A specialized indicator that identifies and visualizes order blocks with volumetric information, helping traders understand market order concentrations and potential price reversal zones.
A dynamic indicator that identifies potential liquidity pools by tracking price interactions with specific zones, helping traders anticipate market movements and institutional trading strategies.
A generalized Gaussian filter that smooths price data with variable pole orders, reducing noise and high-frequency market movements using advanced signal processing techniques.
A liquidity indicator that identifies potential market order zones by mapping swing highs and lows, revealing where stop-loss orders and significant liquidity pools are likely positioned.
Session Sweeps indicator identifies liquidity pools and market shifts across major trading sessions, using session highs/lows to detect potential trend changes and entry points.
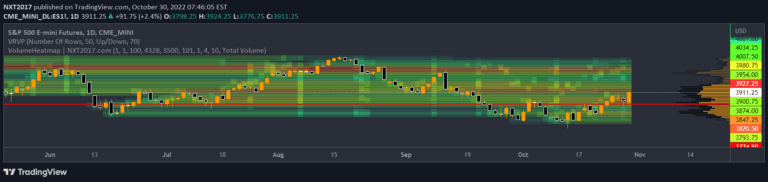
A volume heatmap indicator that identifies price levels with the most trading volume, helping traders find key market activity zones and potential value trading targets.
A trading indicator that identifies untapped liquidity levels across different timeframes, helping traders understand potential price movement magnets and liquidity pools in the market.
Identifies potential liquidation zones for leveraged positions by calculating percentage distances from pivots and tracking buy/sell volumes across different leverage levels.
A comprehensive trading tool combining order blocks and Fibonacci retracements to identify potential market entry and exit points based on significant order zones and mathematical support/resistance levels.
A liquidity grab indicator that highlights market order execution points by rendering unique bubbles on candles where significant liquidity areas are swept with large wicks.
A Smart Money Concepts trading indicator that identifies demand and supply zones, highlighting key liquidity levels and price structure changes across multiple timeframes.
Likes, views, and comments are historical TradingView snapshots. They describe attention, not trading performance.