Trendline Breakouts With Targets [ChartPrime]
An advanced trading indicator that identifies trendline breakouts and breakdowns, providing precise entry signals, target calculations, and visual trade management tools.
Explore 11,183 indicators. Filter beyond the obvious.
Discover the tools that fit the way you trade.
11,183 tools to explore
An advanced trading indicator that identifies trendline breakouts and breakdowns, providing precise entry signals, target calculations, and visual trade management tools.
The 2B reversal pattern identifies potential market trend reversals by detecting false breakouts and price rebounds, signaling opportune entry points for traders.
A precise indicator that identifies double top and bottom reversal patterns in market price action, helping traders recognize potential trend changes with customizable settings and visual enhancements.
A technical analysis tool that scans historical price data to identify chart patterns and project potential future price movements based on historical pattern performance.
A sophisticated trading indicator that tracks consecutive candlesticks across timeframes, helping traders understand market momentum and predict potential trend continuations using historical price patterns.
Advanced multi-timeframe Zigzag indicator offering recursive wave analysis and pattern recognition across different market timeframes with customizable visualization and tracking capabilities.
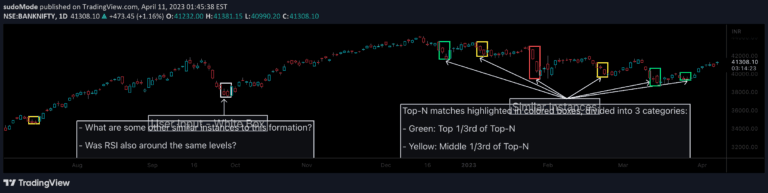
A pattern recognition tool that analyzes price chart similarities by computing vector-based similarities across multiple candle dimensions, highlighting potential matching historical patterns.
A signal that identifies potential market gaps and liquidity zones by analyzing price action between current and previous candles, highlighting areas where significant order activity might exist.
A bull flag pattern identifies potential trend continuation by analyzing a brief consolidation period after an initial price surge, helping traders predict upcoming price movements.
A Fibonacci-based timing pattern that identifies potential medium-term price reversals by analyzing sequential close prices across multiple historical periods.
An advanced chart pattern detection tool that automatically identifies pivot points and key market structures like Double Tops and Double Bottoms to help traders recognize potential trend continuations and reversals.
A trend prediction indicator using pull back structures to determine market direction by analyzing price movement and candle relationships with precise measurements.
Likes, views, and comments are historical TradingView snapshots. They describe attention, not trading performance.