Periodic Linear Regressions [LuxAlgo]
Periodic Linear Regressions (PLR) calculates linear trend lines over customizable periods, helping traders identify underlying price trends and potential support/resistance zones.
Explore 11,183 indicators. Filter beyond the obvious.
Discover the tools that fit the way you trade.
11,183 tools to explore
Periodic Linear Regressions (PLR) calculates linear trend lines over customizable periods, helping traders identify underlying price trends and potential support/resistance zones.
NR4 & NR7 is a pattern recognition indicator that identifies narrow range candles to detect potential market breakouts and low volatility transitions.
A custom trading tool that generates monthly and yearly performance tables for trading strategies, helping traders analyze historical strategy performance and identify key periods of success or weakness.
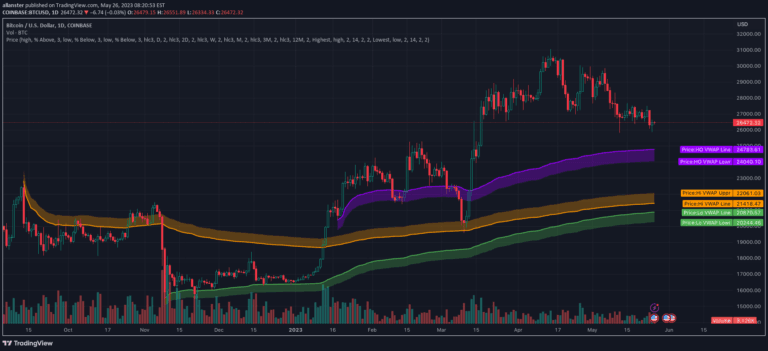
A Volume Weighted Average Price (VWAP) tool that plots VWAP close levels across multiple timeframes, helping traders identify key support and resistance levels.
A trading tool that tracks cumulative buy and sell volumes across different time periods, providing visual insights into market participant behavior and volume dynamics.
Cumulative Volume Delta (CVD) is a technical analysis tool that tracks buying and selling volume to identify potential price trend reversals and market momentum shifts.
An advanced VWAP toolbox that provides multiple anchored VWAP techniques, including pinch and handoff strategies, periodic intervals, and automatic anchor selection for technical analysis.
A trading indicator designed to identify sideways or ranging markets by tracking significant price candles and establishing dynamic range boundaries based on price movement.
A sophisticated signal processing technique that identifies dominant market cycles by applying linear predictive filters to price data, helping traders adapt strategies to changing market conditions.
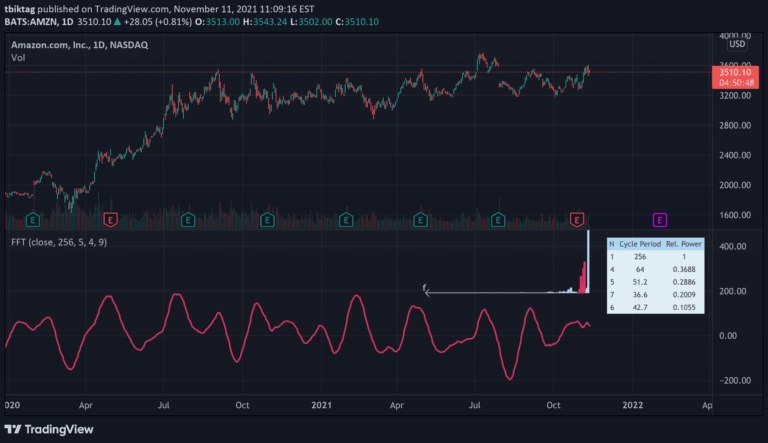
A Fast Fourier Transform (FFT) algorithm that decomposes time series data into cyclical frequency components, enabling advanced time series filtering and analysis.
A price action indicator that identifies potential mean reversion opportunities by tracking highest and lowest points within a selected lookback period and generating alerts.
A volume forecasting indicator that captures periodic volume fluctuations and predicts future trading volume by analyzing historical patterns and intervals.
Likes, views, and comments are historical TradingView snapshots. They describe attention, not trading performance.