YOUR INDICATOR RESEARCH STARTS HERE

Find the right indicator.
Understand what it does.

Explore 11,183 indicators. Filter beyond the obvious.
Discover the tools that fit the way you trade.

THE INDICATOR LIBRARY

Results for “pivotal”

11,183 tools to explore

30 indicators matching your filters
Save search
TrendMomentumEditor’s pick

Divergence-Support/Resistence

by Trendoscope

A trading signal that identifies support and resistance levels using zigzag patterns, divergence detection, and oscillator analysis to highlight potential trend reversals and market momentum shifts.

Main price chart · unverifiedDay Trading · Swing Trading
Explore
3.6Klikes149.2Kviews39comments
Save
TrendMomentumEditor’s pick

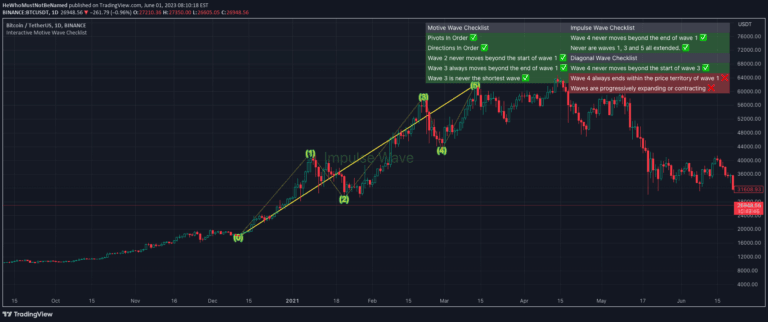
Interactive Motive Wave Checklist

by Trendoscope

Elliott Wave analysis is a technical trading method that identifies market trends by examining price wave patterns, helping traders predict potential market movements and trend reversals.

Main price chart · unverifiedDay Trading · Swing Trading
Explore
2.3Klikes55.2Kviews25comments
Save
LevelsSignal

Pivotal Moments

by allanster

Pivotal Moments tracks and draws pivot high and low levels on a chart, automatically removing levels when they are touched or crossed in real-time trading.

Main price chart · unverifiedScalping · Day Trading
Explore
1.4Klikes21.2Kviews23comments
Save
OscillatorSignalTrend

TrendLine Toolkit w/ Breaks (Real-Time)

by EliCobra

An advanced trading toolkit that extends trendline analysis to oscillators, providing dynamic trend detection, breakout signals, and real-time trend insights across multiple technical indicators.

Separate pane · unverifiedScalping · Day Trading
Explore
1Klikes26.7Kviews5comments
Save
SignalTrendVolatility

TrendLine Scythes

by EliCobra

Trendline Scythes is an advanced charting tool that creates curved trendlines based on price pivots and market volatility, offering unique insights into trend dynamics and potential breakouts.

Main price chart · unverifiedScalping · Day Trading
Explore
864likes24.4Kviews15comments
Save
LevelsSignal

Sup/Res Levels [QuantVue]

by QuantVue

A pivot point indicator that identifies support and resistance levels with volume-based break alerts. Helps traders filter significant price movements and potential trading opportunities.

Main price chart · unverifiedScalping · Day Trading
Explore
838likes22.5Kviews2comments
Save
LevelsSignalTrend

Market structure

by mickes

A market structure indicator that identifies break of structures and change of character using swing points and pivots across internal and swing trends.

Main price chart · unverifiedScalping · Day Trading
Explore
608likes10.1Kviews32comments
Save
LevelsSignalTrend

Zigzag Trend-based Color [SteinG]

by SteinG

A zigzag indicator that identifies price pivot points, color-codes trends, and provides an informative table for analyzing market movements and potential trading opportunities.

Main price chart · unverifiedDay Trading · Swing Trading
Explore
497likes17.9Kviews6comments
Save

Likes, views, and comments are historical TradingView snapshots. They describe attention, not trading performance.

START WITH A QUESTION

A little less searching.
A lot more understanding.

Tell DeepAlpha what you need. Get an explanation, a shortlist,
and a direct path to the indicators behind it.

Ask DeepAlpha