
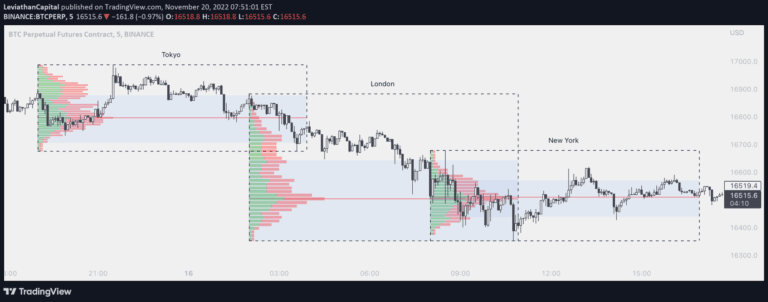
Market sessions and Volume profile - By Leviathan
A comprehensive forex market session tracker with Volume Profile analysis that allows traders to visualize trading activity across different global market sessions and timeframes.
Explore 11,183 indicators. Filter beyond the obvious.
Discover the tools that fit the way you trade.
11,183 tools to explore
A comprehensive forex market session tracker with Volume Profile analysis that allows traders to visualize trading activity across different global market sessions and timeframes.
A technical analysis tool that identifies potential trend reversals by tracking momentum and trend exhaustion phases across bullish, bearish, and ranging markets.
A comprehensive hourly trading system that plots key price levels, identifies trend direction, and highlights potential entry and exit points across different timeframes.
Ghost Tangent Crossings is an innovative pivot point indicator that visualizes market movements using ellipses, dynamically tracking zig-zag patterns and potential price breakouts.
A trend channel indicator that identifies support and resistance zones using pivot highs and lows, helping traders visualize market trends and potential breakout points.
A comprehensive trading indicator combining Parabolic SAR, EMA 200, and MACD to generate precise buy and sell signals by analyzing market trends and momentum.
A comprehensive trading framework designed to help traders develop, analyze, and manage trading strategies with advanced risk and reward tracking capabilities across multiple market conditions.
An advanced Ichimoku Kinko Hyo indicator with extensive customization options for analyzing market trends, momentum, and potential trading signals across different timeframes.
A liquidity indicator that identifies potential market order zones by mapping swing highs and lows, revealing where stop-loss orders and significant liquidity pools are likely positioned.
A unique trading indicator combining Murrey Math formulas with Fibonacci retracement levels to identify potential market tops, bottoms, and long-term trend dynamics with enhanced precision.
A comprehensive trading toolkit combining RSI divergences, correction zones, and advanced support/resistance levels to help traders analyze market movements and potential trend reversals.
Momentum Bars (Mo_Bars) is a three-moving average based indicator that visualizes relative momentum changes, helping traders identify potential trend shifts and momentum direction.
Likes, views, and comments are historical TradingView snapshots. They describe attention, not trading performance.