ADX and DI
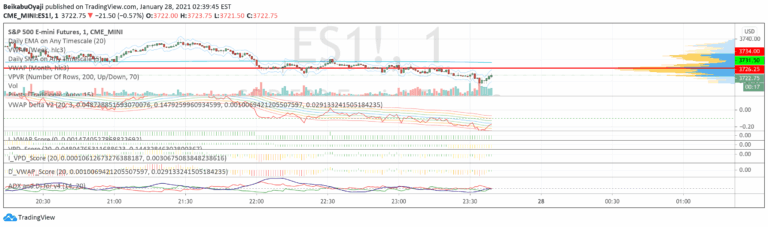
ADX measures trend strength and direction by analyzing price movement. It helps traders identify the presence and power of a trend, indicating whether a market is trending or ranging.
Explore 11,183 indicators. Filter beyond the obvious.
Discover the tools that fit the way you trade.
11,183 tools to explore
ADX measures trend strength and direction by analyzing price movement. It helps traders identify the presence and power of a trend, indicating whether a market is trending or ranging.
A liquidity indicator that highlights swing areas with trading activity, tracking price revisits, accumulated volume, and potential support/resistance zones using customizable filtering.
A daily indicator identifying supply and demand areas using market data, highlighting potential support and resistance levels based on price and volume interactions.
ICT Algorithmic Macro Tracker plots key trading time windows based on Inner Circle Trader methodology, helping traders identify potential market movement periods across specific time intervals.
A comprehensive candlestick pattern indicator that detects market trends and aligns candlestick patterns with those trends, providing insights into potential market movements.
A unique trading indicator combining Murrey Math formulas with Fibonacci retracement levels to identify potential market tops, bottoms, and long-term trend dynamics with enhanced precision.
A cumulative volume delta indicator that analyzes intrabar volume to provide insights into market sentiment by tracking net buying and selling pressure across different time frames.
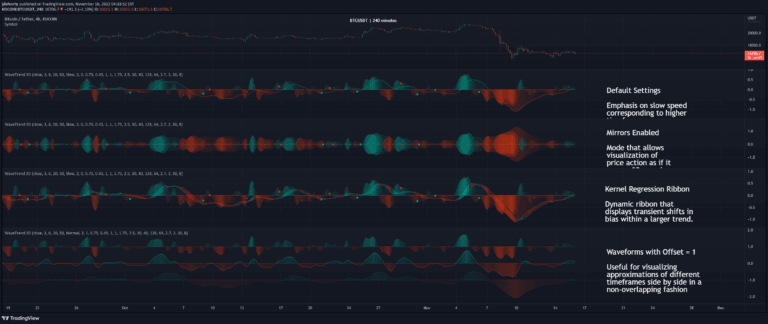
WaveTrend 3D is an advanced oscillator that uses digital signal processing and machine learning techniques to analyze price trends with enhanced precision and multi-timeframe support.
Advanced volume profile indicator offering high-resolution analysis of trading volume across multiple range modes, providing traders with detailed insights into market structure and price-volume relationships.
A dynamic indicator that identifies and visualizes support and resistance zones by analyzing pivot points using multiple scoring methods and customizable visualization techniques.
A trading system for identifying potential trend reversals using setup and count methods with support and resistance levels for strategic market entry and exit points.
A comprehensive volume profile tool that analyzes trading activity across multiple time resolutions, revealing market structure, price acceptance zones, and directional volume pressure.
Likes, views, and comments are historical TradingView snapshots. They describe attention, not trading performance.