AI Channels (Clustering) [LuxAlgo]
AI Channels indicator uses K-means clustering to identify trend directions and potential price breakouts by analyzing price clusters and their centroids dynamically.
Explore 11,183 indicators. Filter beyond the obvious.
Discover the tools that fit the way you trade.
11,183 tools to explore
AI Channels indicator uses K-means clustering to identify trend directions and potential price breakouts by analyzing price clusters and their centroids dynamically.
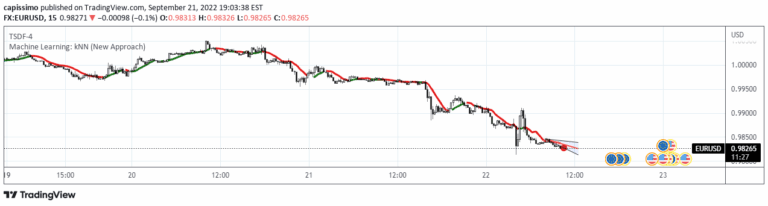
KNN is a machine learning technique predicting next price bar using nearest neighbor data points, providing trend insights by analyzing historical price sequences.
A precise indicator that identifies double top and bottom reversal patterns in market price action, helping traders recognize potential trend changes with customizable settings and visual enhancements.
A sophisticated trading indicator that tracks median price proximity using percentile calculations within dynamic standard deviation bands to help traders identify market trends and potential reversals.
A dynamic range detection indicator that uses ADX and gradient candlesticks to identify market conditions, range boundaries, and potential mean reversion points.
A powerful trading indicator combining VWAP and EMA to generate buy and sell signals with AI-inspired confidence scoring, helping traders identify high-probability trend continuation opportunities.
A novel trading indicator using ATR Bands, candle wick analysis, and Stochastic RSI to identify potential price pivots and entry points across different market conditions.
Advanced support and resistance indicator that automatically identifies high-confidence trading levels using proximity, bounce frequency, and volume clustering across multiple markets.
A volume-based support and resistance indicator that identifies significant price zones by clustering high-volume points of control and providing dynamic visual representation of potential market turning points.
A comprehensive stock market trend indicator developed by Mark Minervini that assesses multiple moving average relationships and price positioning to identify potential bullish market conditions.
A dynamic trading indicator that analyzes price fluctuations relative to the median, providing insights into market trends, potential reversals, and price deviations through normalized calculations.
An advanced Stochastic Oscillator variant that identifies neutral market states by analyzing the convergence of %K and %D lines, offering refined momentum insights.
Likes, views, and comments are historical TradingView snapshots. They describe attention, not trading performance.