YOUR INDICATOR RESEARCH STARTS HERE

Find the right indicator.
Understand what it does.

Explore 11,183 indicators. Filter beyond the obvious.
Discover the tools that fit the way you trade.

THE INDICATOR LIBRARY

Results for “quarters”

11,183 tools to explore

21 indicators matching your filters
Save search
LevelsTrendVolume

Range Analysis - By Leviathan

by LeviathanCapital

An advanced trading tool that analyzes price ranges by automatically drawing range levels, volume profiles, and various analytical tools to help traders understand market structure and potential price movements.

Main price chart · unverifiedScalping · Day Trading
Explore
4.7Klikes89.1Kviews41comments
Save
LevelsSignal

Quarterly Earnings

by finallynitin

A TradingView script that displays quarterly earnings per share and sales data with year-on-year percentage changes, offering customizable visualization of financial performance metrics.

Main price chart · unverifiedSwing Trading
Explore
3.7Klikes44.7Kviews66comments
Save
LevelsSignal

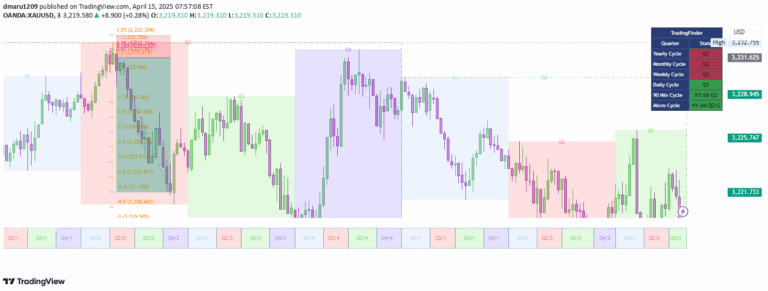
90 Minute Cycles + MTF

by HandlesHandled

A trading approach that divides the day into quarters and 90-minute cycles, analyzing market phases of Accumulation, Manipulation, Distribution, and Rebalance.

Main price chart · unverifiedScalping · Day Trading
Explore
1.2Klikes28.1Kviews31comments
Save
SignalTrend

AMDX-XAMD

by Giovanni-1-

A versatile trading indicator that divides market sessions into four quarters, analyzing price behavior and potential market movements across different trading timeframes.

Main price chart · unverifiedScalping · Day Trading
Explore
717likes23Kviews26comments
Save
SignalLevels

90cycle @joshuuu

by joshuuu

A 90-minute cycle trading concept focusing on specific time windows during global market sessions, helping traders identify potential price movements within predefined timeframes.

Main price chart · unverifiedScalping · Day Trading
Explore
660likes10.9Kviews15comments
Save
SignalTime

Daye's Quarterly Theory

by iitatitus55

A trading indicator that divides the trading day into quarterly time segments, helping traders identify market phases like accumulation, manipulation, distribution, and trend continuation.

Main price chart · unverifiedScalping · Day Trading
Explore
263likes8.8Kviews3comments
Save
LevelsSignal

Time-based Liquidity

by OGDub

A dynamic indicator that automatically marks key time-based liquidity levels across different timeframes, helping traders identify potential price reaction zones and market turning points.

Main price chart · unverifiedScalping · Day Trading
Explore
201likes2.7Kviews17comments
Save
LevelsSignalTrend

CYCLE BY RiotWolftrading

by anarkiacapital

A custom TradingView indicator that visualizes cyclic market phases, dividing trading sessions into quarters and identifying potential support and resistance levels.

Main price chart · unverifiedScalping · Day Trading
Explore
191likes3.1Kviews1comments
Save

Likes, views, and comments are historical TradingView snapshots. They describe attention, not trading performance.

START WITH A QUESTION

A little less searching.
A lot more understanding.

Tell DeepAlpha what you need. Get an explanation, a shortlist,
and a direct path to the indicators behind it.

Ask DeepAlpha