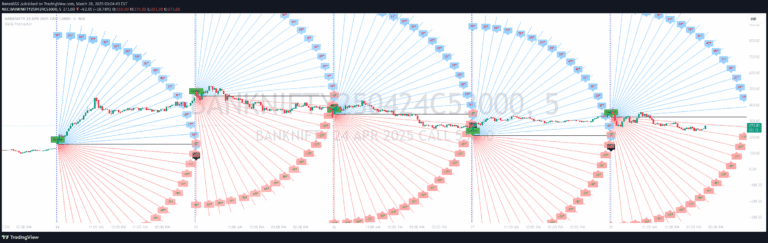
Radius Trend [ChartPrime]
A dynamic technical analysis tool that visualizes market trends using adaptive radius-based bands that adjust to price action and volatility, providing insights into trend direction and strength.
Explore 11,183 indicators. Filter beyond the obvious.
Discover the tools that fit the way you trade.
11,183 tools to explore
A dynamic technical analysis tool that visualizes market trends using adaptive radius-based bands that adjust to price action and volatility, providing insights into trend direction and strength.
A polar chart tool that visualizes cryptocurrency dominance by combining traded dollar volume and volatility across multiple timeframes for easy comparative analysis.
A unique Pine Script indicator that uses polyline drawing to create a Spongebob character on trading charts, dynamically scaling to the price axis using Average True Range.
A geometric trading tool that uses a protractor overlay on 5-minute charts to analyze price action through angular measurements, helping traders identify potential support, resistance, and trend directions.
A dynamic geometric visualization tool that transforms mathematical constants and Fibonacci sequences into evolving chart patterns, offering unique insights into market movements and mathematical relationships.
The Rainbow Indicator is a visual price action tool that creates seven color-coded bands around a moving average using standard deviation to represent price dynamics.
A geometric visualization technique using intersecting circles to create a Vesica Piscis pattern, offering unique insights into chart analysis and potential trading zones.
An artistic visual indicator that creates a rotating pinwheel design with customizable spoke colors and rotation parameters for decorative chart visualization.
Likes, views, and comments are historical TradingView snapshots. They describe attention, not trading performance.