
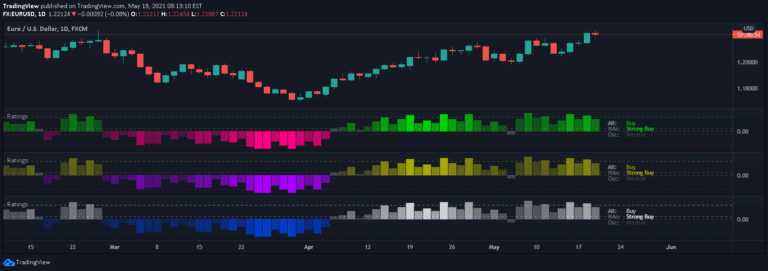
Technical Ratings
A comprehensive trading signal that aggregates 26 technical indicators into a single rating, evaluating market sentiment through moving averages and oscillators to provide actionable trading insights.
Explore 11,183 indicators. Filter beyond the obvious.
Discover the tools that fit the way you trade.
11,183 tools to explore
A comprehensive trading signal that aggregates 26 technical indicators into a single rating, evaluating market sentiment through moving averages and oscillators to provide actionable trading insights.
A trading signal that combines trend bias, oscillator analysis, and divergence detection to help traders make more informed decisions about trend continuation, reversal, and potential profit-taking.
The RS Rating evaluates a stock's price performance relative to the market over 52 weeks, helping traders identify stocks that are outperforming and potentially poised for further gains.
A trading tool that identifies top-performing stocks within specific industry groups by analyzing performance metrics like YTD return and relative strength.
A comprehensive TradingView script that mimics MarketSmith charts, offering customizable moving averages, RS Rating, and high/low point detection for technical analysis.
A comprehensive RSI heatmap screener that provides multi-asset market sentiment analysis through color-coded RSI visualization and detailed trading insights.
A comprehensive technical rating indicator that aggregates 26 different technical indicators across moving averages and oscillators to provide a consolidated trading signal.
A Pine script indicator tracking liquidity levels and sweeps, identifying key price points where market direction may change using swing highs and lows with strength rating.
Advanced technical analysis tool identifying strong support and resistance levels using volume, momentum, and multiple analytical features to help traders make informed market decisions.
Market Smith's advanced charting tool providing comprehensive stock analysis through moving averages, pivot points, relative strength line, and rating to evaluate stock performance.
A comprehensive multi-component trading indicator that combines trend, momentum, volume, and volatility analysis to provide actionable market insights and signal generation.
A custom speedometer visualization tool that converts complex market data like analyst recommendations and put-call ratios into an intuitive graphical representation of market sentiment and trend.
Likes, views, and comments are historical TradingView snapshots. They describe attention, not trading performance.
