Auto Chart Patterns [Trendoscope®]
An advanced algorithmic indicator that automatically identifies and classifies complex chart patterns by analyzing trend lines, pivot points, and geometric formations across multiple timeframes.
Explore 11,183 indicators. Filter beyond the obvious.
Discover the tools that fit the way you trade.
11,183 tools to explore
An advanced algorithmic indicator that automatically identifies and classifies complex chart patterns by analyzing trend lines, pivot points, and geometric formations across multiple timeframes.
A generalized Gaussian filter that smooths price data with variable pole orders, reducing noise and high-frequency market movements using advanced signal processing techniques.
A multi-level moving average strategy that identifies trend strength by analyzing recursive moving averages across multiple levels, providing insights into market trend direction and potential reversals.
ABC Pattern is a three-wave corrective trading indicator that identifies potential trend reversals and price movements by analyzing impulse and corrective waves in market trends.
A comprehensive indicator that scans and highlights multiple reversal chart patterns like Double Tops, Cup and Handles, and Head and Shoulders using recursive zigzag analysis.
A recursive zigzag indicator that visualizes price structures, helps identify patterns, and allows for complex algorithmic trading strategies by analyzing multiple zigzag levels.
The Kalman Price Filter is an advanced algorithmic tool that smooths financial data, helping traders identify true market trends by filtering out noise and adaptively tracking price movements.
Advanced multi-timeframe Zigzag indicator offering recursive wave analysis and pattern recognition across different market timeframes with customizable visualization and tracking capabilities.
An object-oriented approach to developing trading indicators in Pine Script, focusing on creating reusable components through types and methods for enhanced code organization and flexibility.
Volume Forks is an advanced trading indicator that combines recursive auto-pitchfork and angled volume profile to analyze price dynamics and trend formations automatically.
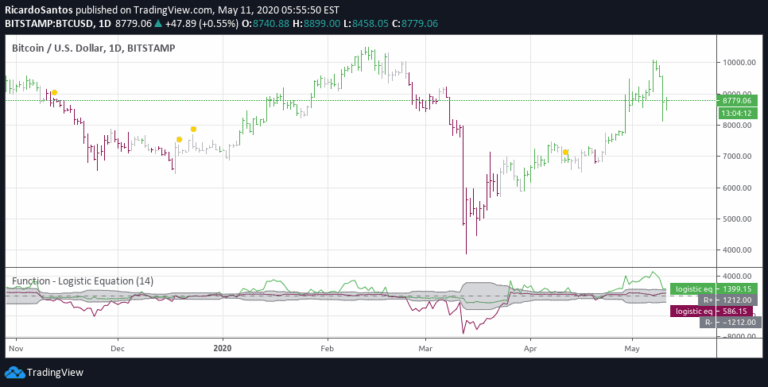
An experimental trading approach exploring the logistic equation's potential correlation with market dynamics, suggesting mathematical patterns might predict or explain market behavior.
A momentum analysis tool tracking Price Momentum Oscillator (PMO) with clear visual signals. Identifies potential trend reversals through custom smoothing and crossover indicators.
Likes, views, and comments are historical TradingView snapshots. They describe attention, not trading performance.