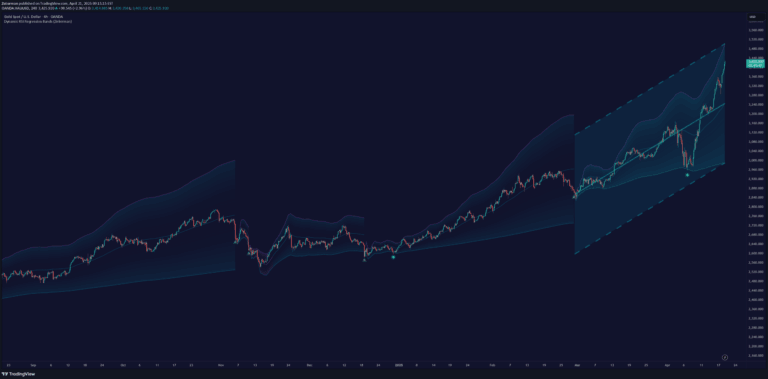
Supply and Demand Visible Range [LuxAlgo]
A volume-based indicator that identifies supply and demand zones on a chart, revealing potential support and resistance levels using precise volume and price analysis.
Explore 11,183 indicators. Filter beyond the obvious.
Discover the tools that fit the way you trade.
11,183 tools to explore
A volume-based indicator that identifies supply and demand zones on a chart, revealing potential support and resistance levels using precise volume and price analysis.
A sophisticated trading signal that combines trend detection, price rejection logic, and dynamic ATR-based target projection to identify and validate potential trend continuation opportunities.
An indicator that identifies Fair Value Gaps and tracks price interactions, highlighting potential support and resistance zones based on price action and market energy.
A market structure analysis tool that combines swing point detection with volatility bands to identify trend shifts, breakouts, and potential reversal points in price action.
A dynamic RSI-based regression channel that adapts to market momentum by resetting its trend analysis when RSI crosses overbought or oversold levels, revealing potential trend shifts.
A higher timeframe trend mapping tool that visually overlays market structure, trend direction, and price boundaries onto intraday charts for enhanced trading context.
ICT trading strategy focuses on identifying optimal trade entry points using price action and smart money concepts, analyzing order blocks, fair value gaps, and market session dynamics.
An advanced trading indicator combining Kalman Filtering and Supertrend to dynamically analyze market trends, detect price movements, and provide customizable trend signals with precision.
Volume Profile indicator that analyzes trading volume at different price levels, revealing key volume points of control and high volume nodes for trading insights.
A scalping indicator using multiple candlestick patterns to identify high-probability trading opportunities across different timeframes with minimal indicator reliance.
A dynamic indicator that identifies key support and resistance levels by analyzing price action, candlestick patterns, and market movements to help traders spot potential reversal points.
A volumetric rejection block indicator that identifies key price levels with significant buying or selling pressure, helping traders analyze market sentiment and potential trend reversals.
Likes, views, and comments are historical TradingView snapshots. They describe attention, not trading performance.