CVD - Cumulative Volume Delta (Chart)
A cumulative volume delta indicator that analyzes intrabar volume to provide insights into market sentiment by tracking net buying and selling pressure across different time frames.
Explore 11,183 indicators. Filter beyond the obvious.
Discover the tools that fit the way you trade.
11,183 tools to explore
A cumulative volume delta indicator that analyzes intrabar volume to provide insights into market sentiment by tracking net buying and selling pressure across different time frames.
A multi-asset performance indicator that tracks percentage changes across 30 symbols, offering comprehensive insights into asset performance, correlation, and market dynamics.
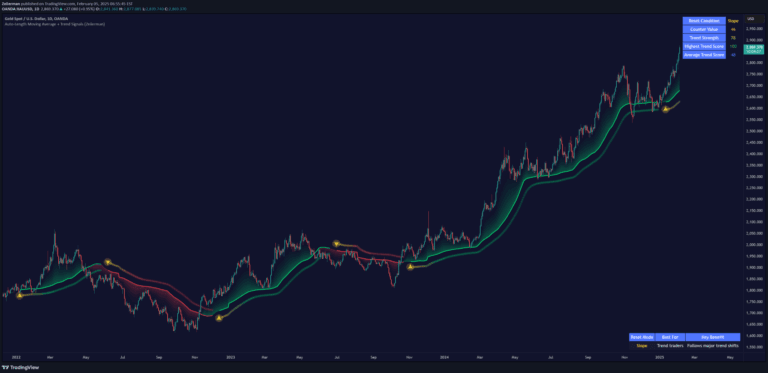
An adaptive moving average indicator that dynamically adjusts length based on trend strength, helping traders identify market momentum and potential trend reversals with enhanced precision.
A volume profile indicator that automatically calculates point of control (POC) for different time periods, identifying significant price levels and market structure across various trading timeframes.
A dynamic trailing stop indicator using Fair Value Gaps (FVG) to identify trend direction and potential trend reversals by tracking unmitigated price gaps.
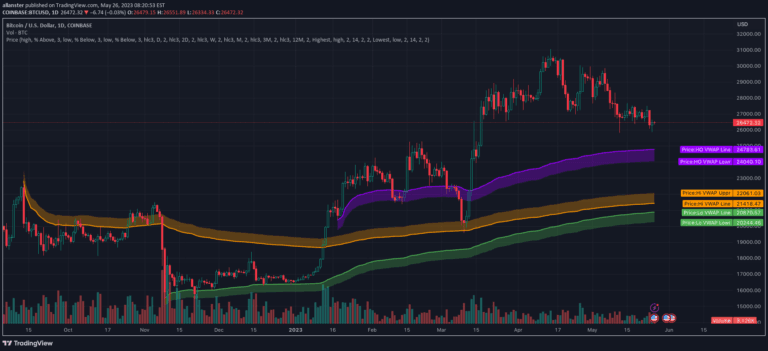
An advanced VWAP toolbox that provides multiple anchored VWAP techniques, including pinch and handoff strategies, periodic intervals, and automatic anchor selection for technical analysis.
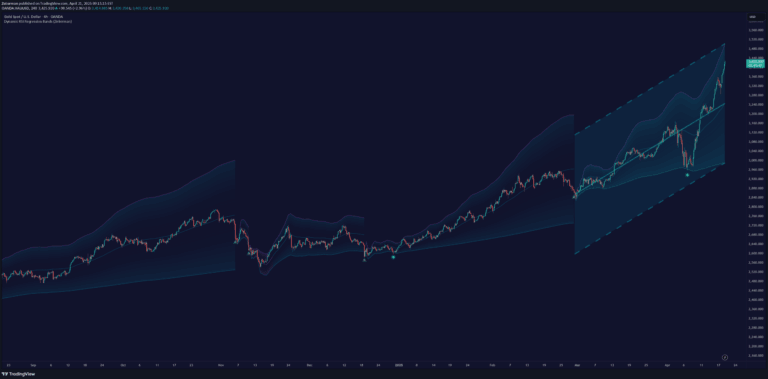
A dynamic RSI-based regression channel that adapts to market momentum by resetting its trend analysis when RSI crosses overbought or oversold levels, revealing potential trend shifts.
A sophisticated trading indicator that combines MIDAS methodology, volume-weighted average price, standard deviation bands, and Fibonacci levels to analyze market trends and potential price movements.
An advanced market structure indicator that identifies potential trend reversals by detecting Break of Structure (BoS) and Change of Character (CHoCH) signals with visual and alert features.
A 3-moving average crossover strategy that generates trading signals by tracking the relationship between fast, medium, and slow moving averages to identify trend direction and potential trade opportunities.
A custom moving average-based trend indicator that tracks price positioning relative to a moving average, measuring trend strength and potential market transitions.
A 10-minute Opening Range indicator that identifies the initial price range and momentum at market open, marking key levels for potential trading strategies.
Likes, views, and comments are historical TradingView snapshots. They describe attention, not trading performance.