Double Ribbon [ChartPrime]
The Double Ribbon indicator combines two Simple Moving Average ribbons to assess market trends and momentum, providing a visual and quantitative analysis of market direction and strength.
Explore 11,183 indicators. Filter beyond the obvious.
Discover the tools that fit the way you trade.
11,183 tools to explore
The Double Ribbon indicator combines two Simple Moving Average ribbons to assess market trends and momentum, providing a visual and quantitative analysis of market direction and strength.
A normalized MACD indicator that combines moving average convergence divergence with stochastic principles to provide flexible market trend analysis and trading signals.
Advanced trend analysis tool using Hull Moving Average with ATR thresholds and VWAP ribbons to identify market momentum, potential reversals, and trend direction with reduced lag.
A multi-factor trading signal that combines Open Interest RSI, funding rates, and fractal divergences to identify potential market exhaustion and mean-reversion trade opportunities.
An advanced RSI signal engine that provides institutional-grade trading insights with divergence detection, trap identification, and multi-timeframe confluence for precise market entry points.
A dynamic trend tracking script using customizable moving averages that identifies market direction, generates visual trend ribbons, and provides alerts for potential trend changes.
EMA + VWAP combines Exponential Moving Averages with Volume Weighted Average Price to track market trends, momentum, and critical price zones for precise trading decisions.
A comprehensive Bitcoin macro trend analysis tool that combines multiple economic indicators to identify market peaks and troughs with enhanced probabilistic insights.
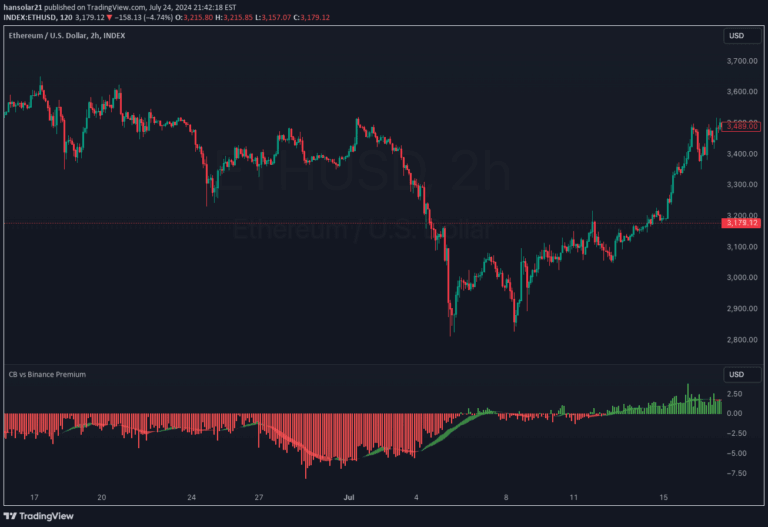
A premium indicator tracking price differences between Coinbase and Binance for 31 cryptocurrencies, offering insights into market buying strength and trend dynamics.
A dynamic trading indicator using Heiken Ashi moving averages to identify market trends and strength through color-coded ribbons that adapt to market conditions.
A comprehensive Moving Average toolkit that offers multiple MA visualization, dynamic ribbons, and customizable crossover alerts for identifying market trends and potential trading opportunities.
A dynamic trading tool combining daily pivot levels with EMA ribbons to help traders identify market structure, momentum, and key decision zones with visual clarity.
Likes, views, and comments are historical TradingView snapshots. They describe attention, not trading performance.